Mean, Median, Mode, Standard Deviation - Basic Statistics Calculator Practice
In the SAT Math section, you will often encounter questions assessing your understanding of fundamental statistical measures: mean, median, mode, and standard deviation. Whether applied to a small set of raw data or summarized in a table or graph, these measures help describe the central tendency and spread of data. Mastery of these topics not only helps with direct questions about data sets, but also with word problems and data analysis items found in the Problem Solving and Data Analysis domain.
Below, you will find 50 carefully crafted practice questions, each with a detailed solution. They address typical SAT-style scenarios: finding the average of numbers, analyzing quartiles and medians, computing modes, handling outliers' effects, and interpreting standard deviations. Some questions also combine multiple concepts or require you to update these measures after data modifications.
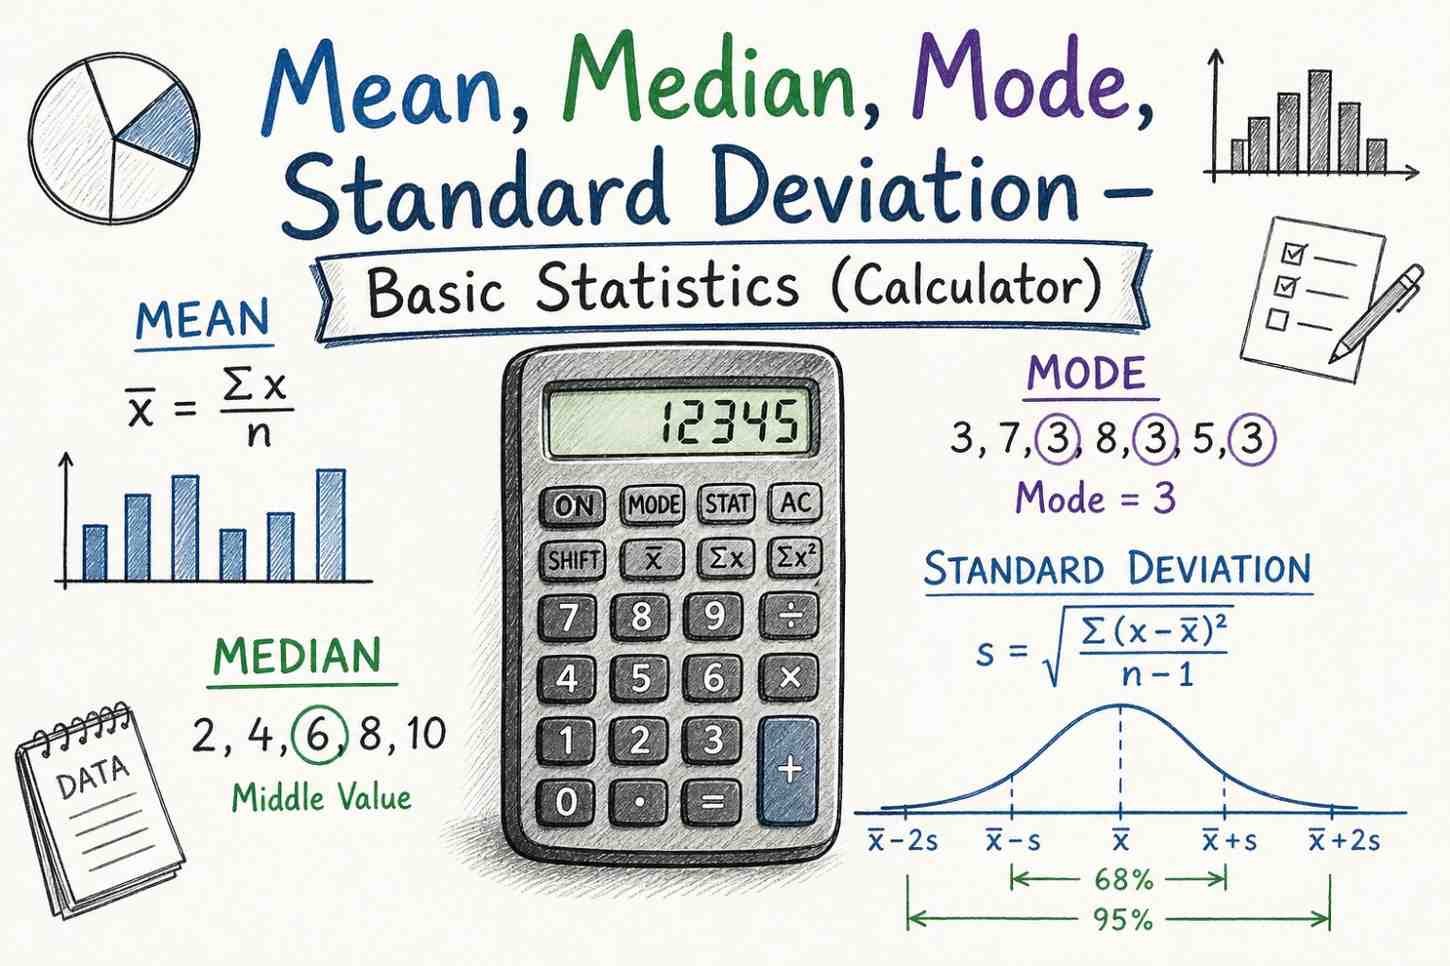
Because this is the calculator portion, you can rely on calculator arithmetic to handle sums and squares quickly. Still, it is crucial to understand the conceptual meaning of each statistic. For instance, the mean (average) is the sum of all data points divided by the number of data points; the median is the middle data point when sorted (or the average of the two middle points if there is an even number of data points); the mode is the most frequently occurring value; and the standard deviation measures how spread out the data points are around their mean.
Study each problem carefully, verify your calculations, and read through the step-by-step solutions to deepen your understanding. By practicing these questions, you will develop a solid grounding in basic statistics that will serve you well, not only for the SAT but also in more advanced math and real-world data analysis.
How to use this page: Review the formulas and interpretation notes first, then work through the questions without looking at the solutions. Use a calculator for arithmetic, but write the setup for each statistic. The goal is not only to get an answer; it is to know which statistic is appropriate and what the answer means in context.
Core Formulas for Mean, Median, Mode, Range, and Standard Deviation
The mean, median, mode, and standard deviation are basic statistics, but they answer different questions. The mean describes the arithmetic balance point of a dataset. The median describes the middle after sorting. The mode describes the most frequent value. Standard deviation describes spread around the mean. A strong SAT statistics answer usually starts by identifying which question is being asked before doing any arithmetic.
Mean:
\[ \bar{x}=\frac{x_1+x_2+\cdots+x_n}{n}=\frac{\sum x_i}{n} \]
The mean is sensitive to every value in the set. If one very large or very small outlier is added, the mean can shift noticeably.
Median: Sort the values from least to greatest. If there are an odd number of values, the median is the middle value. If there are an even number of values, the median is the average of the two middle values.
\[ \text{Median for even } n=\frac{\text{lower middle}+\text{upper middle}}{2} \]
The median is resistant to extreme values, so it is often more useful than the mean for skewed data such as income, house prices, and waiting times.
Mode: The mode is the value or values that appear most often. A dataset may have no mode, one mode, two modes, or more than two modes.
Mode is especially useful when the most common category matters, such as the most common score, shoe size, response choice, or rating.
Range and standard deviation:
\[ \text{Range}=\max(x)-\min(x) \]
\[ s=\sqrt{\frac{\sum (x_i-\bar{x})^2}{n-1}} \]
Range is simple but depends only on the smallest and largest values. Standard deviation uses every value and measures typical spread from the mean.
If you want a direct calculation tool for a short list of values, use the mean median mode calculator. If your main focus is spread, the standard deviation calculator is a focused companion. This page is different: it combines SAT-style practice, formulas, and worked reasoning so you can understand the method behind the calculator result.
Calculator Strategy for SAT Basic Statistics Questions
On the SAT calculator section, you may use a calculator for arithmetic, but the test still expects statistical reasoning. The calculator can add numbers, divide by \(n\), and evaluate square roots quickly. It will not decide whether you need the mean or median, whether an outlier matters, whether the set must be sorted, or whether a transformation changes spread. Those decisions come from understanding the wording of the question.
A reliable strategy is to mark the dataset type before calculating. If the question asks for "average", it is usually asking for the mean unless the wording says otherwise. If it asks for "middle value", it is asking for the median. If it asks for "most common", it is asking for the mode. If it asks which set is more spread out, standard deviation, range, or interquartile range may be involved. If it asks what happens after adding a high outlier, think about which statistics are resistant and which are sensitive.
When calculating the mean, add carefully and divide by the correct number of data points. For example, if a data table says a value occurs three times, it must be counted three times in the sum and in the total count. For weighted mean questions, multiply each value by its frequency first:
\[ \text{Weighted Mean}=\frac{\sum (x_i f_i)}{\sum f_i} \]
When calculating the median, always sort the values first. Many SAT distractor answers come from taking the middle of an unsorted list. For an even number of values, do not choose one of the two middle values; average them. When a missing value appears in a sorted list, use the median position to determine what restrictions the missing value must satisfy.
For a broader statistics reference, the statistics calculator page covers additional tools such as correlation, confidence intervals, and t-tests. For formula review beyond SAT basics, use the statistics and probability formulas page.
Mean vs Median: How Outliers Change the Answer
The mean and median often move in different ways when a dataset changes. The mean uses the exact value of every data point, so an outlier can pull the mean toward the tail. The median uses position after sorting, so one extreme value may have little or no effect on the median. This is why many real-world summaries use median income rather than mean income: a small number of extremely high incomes can pull the mean upward and make the "typical" value look higher than most people experience.
Suppose a dataset is \(4, 5, 6, 7, 8\). The mean is \(6\), and the median is \(6\). If the value \(100\) is added, the mean becomes \( \frac{4+5+6+7+8+100}{6}=\frac{130}{6}\approx 21.67 \). The median becomes the average of \(6\) and \(7\), which is \(6.5\). The mean changed dramatically, while the median changed only slightly. This is a classic outlier effect.
On SAT questions, watch for phrases such as "which statistic is most affected by an outlier?" or "which measure best represents a typical value?" The answer often depends on whether the distribution is skewed. In a right-skewed distribution, the mean is usually greater than the median. In a left-skewed distribution, the mean is usually less than the median. For a symmetric distribution, the mean and median are often close.
If you need a student-friendly explanation of measures of center and range, see mean, median, mode, and range explained. The practice questions below reinforce those same ideas with SAT-style prompts.
Understanding Standard Deviation Without Overcomplicating It
Standard deviation measures typical distance from the mean. A small standard deviation means the values are close together. A large standard deviation means the values are more spread out. On the SAT, you usually do not need to compute a long standard deviation formula by hand unless the set is very small. More often, you need to compare spread, understand what happens when all values shift, or recognize that identical values have standard deviation zero.
The most important transformation rules are simple. If the same constant is added to every value, the mean and median shift by that constant, but the standard deviation does not change. For example, if every score increases by \(5\), all values move together; spread stays the same. If every value is multiplied by \(3\), the mean, median, range, and standard deviation are all multiplied by \(3\). If every value is multiplied by \(-2\), the standard deviation is multiplied by \(|-2|=2\), because standard deviation cannot be negative.
Standard deviation is connected to variance. Variance averages squared deviations from the mean, while standard deviation takes the square root of variance. This brings the unit back to the original unit of the data. If scores are measured in points, standard deviation is also in points. If heights are measured in centimeters, standard deviation is in centimeters. For formula-level review, use standard deviation formulas and variance formulas.
Common Mistakes in SAT Statistics Questions
The first common mistake is forgetting to sort data before finding the median. The second is using the number of distinct values instead of the total number of data points when calculating a mean from a frequency table. The third is assuming every dataset has exactly one mode. A set can have no repeated values, one repeated value, or several values tied for most frequent.
Another common mistake is confusing range and standard deviation. Range uses only the maximum and minimum values, while standard deviation uses all values. Two datasets can have the same range but different standard deviations if one set is clustered near the center and the other is spread more evenly. Similarly, two datasets can have the same mean but very different spreads.
Students also sometimes treat standard deviation as if it changes when every value is increased by the same amount. It does not. If each score in a class rises by \(10\) points, the entire distribution shifts right by \(10\), but the distances between scores stay the same. Standard deviation changes only when the distances among the values change, such as when all values are multiplied or when a new outlier is added.
For more general statistics study material, use statistics free learning resources or the statistics cheat sheet. If you need arithmetic support while checking examples, the scientific calculator can help with sums, square roots, and multi-step expressions.
How to Interpret Calculator Results Correctly
A calculator can return the mean, median, mode, variance, and standard deviation quickly, but the interpretation still belongs to the student. Before trusting the result, check the size of the dataset, the order of the values, and whether the question is asking for a population statistic or a sample statistic. A population statistic describes the entire group in the problem. A sample statistic estimates a larger group using only part of the data. That is why sample standard deviation divides by \(n-1\), while population standard deviation divides by \(n\).
When you enter data into a calculator, keep repeated values repeated. For example, the dataset 2, 2, 2, 8, 9 is not the same as the list of distinct values 2, 8, 9. The mean, mode, median, and standard deviation all depend on frequency. If a question gives a frequency table, multiply each value by its frequency before finding the total. This is one of the most common mistakes in basic statistics, especially when the data are presented in a table instead of a simple list.
After the calculator gives an answer, ask whether it makes sense. The mean should fall between the minimum and maximum values. The median should be one of the middle values or the average of the two middle values. The standard deviation should never be negative. If all values are identical, the standard deviation must be 0. If a new outlier is added, the mean and standard deviation often change more than the median. These quick checks help you catch typing errors and prevent calculator-only mistakes.
For a fuller conceptual review, the descriptive statistics guide explains how measures of center and spread work together. If you are reviewing the calculation process step by step, use calculating statistics alongside this practice page. Students building a broader foundation can also review statistics fundamentals before attempting mixed exam-style questions.
Question 1
A small class of 5 students has test scores of 70, 75, 80, 85, and 90.
(a) What is the mean score?
(b) What is the median score?
(c) What is the mode?
Solution
(a) The mean is the sum of all scores divided by the number of students. Sum = 70 + 75 + 80 + 85 + 90 = 400. There are 5 scores, so mean = 400 / 5 = 80.
(b) Because there are 5 scores listed in ascending order, the median is the middle one, which is the 3rd score. That's 80.
(c) The mode is the most frequent score. In this list, all scores appear exactly once, so there is no single mode. Some texts might say "no mode" or "all are equally common."
Question 2
A teacher records quiz scores for 6 students: 8, 7, 10, 9, 10, 8.
(a) Find the mean.
(b) Find the median.
(c) Identify the mode(s).
Solution
First, let's sort them: 7, 8, 8, 9, 10, 10.
(a) Mean = sum / number of scores = (7 + 8 + 8 + 9 + 10 + 10) / 6 = 52 / 6 = 8.67 (approx).
(b) Since there are an even number (6) of data points, the median is the average of the 3rd and 4th values in sorted order. 3rd = 8, 4th = 9, so median = (8 + 9)/2 = 8.5.
(c) The values 8 and 10 each appear twice, more than the others which appear once each, so the modes are 8 and 10 (two modes).
Question 3
A set of 8 data points has a mean of 12. If one new data point, 20, is added to the set, what is the mean of the 9-point data set?
Solution
Original 8 data points have a total sum = 8 × 12 = 96. When we add one new data point of 20, the sum becomes 96 + 20 = 116. Now we have 9 total data points. The new mean = 116 / 9 = about 12.89.
Question 4
A list of 7 numbers in ascending order is 4, 4, 5, m, 6, 8, 12. If the median of the list is 5.5, find m.
Solution
Because there are 7 numbers, the median is the 4th number in sorted order. The 4th number is m, and it's given that the median is 5.5, so m=5.5.
Question 5
The test scores for a group are: 81, 83, 85, 86, 90, 92, 95. The mean is 87.4, and the standard deviation (population) is about 4.9. If every student's test score is increased by 5 points, which of the following statements is correct about the new mean and new standard deviation?
Solution
Adding a constant to each data point increases the mean by that constant but does not affect the standard deviation. So the new mean is 87.4 + 5 = 92.4, and the new standard deviation remains about 4.9.
Question 6
A population has 5 data values: 2, 4, 6, 6, 12.
(a) Find the mean.
(b) Find the sample standard deviation if we treat these 5 as a sample. Round to nearest tenth.
Solution
(a) Mean = (2 + 4 + 6 + 6 + 12) / 5 = 30 / 5 = 6.
(b) For a sample standard deviation, we compute:
1) Deviations from mean: (2-6)= -4, (4-6)= -2, (6-6)=0, (6-6)=0, (12-6)=6.
2) Squares: 16, 4, 0, 0, 36 ⇒ sum= 56.
3) Because it is a sample standard deviation with \(n=5\), divide 56 by \(5-1=4\). The sample variance is \(56/4=14\), so \(s=\sqrt{14}\approx 3.74\). Rounded to the nearest tenth, the sample standard deviation is 3.7.
Question 7
A certain dataset of 10 values has mean 50. If one value is removed and the mean of the remaining 9 values becomes 47, find the removed value's deviation from the original mean.
Solution
The original sum for 10 values is \(10 \times 50=500\). After one value is removed, the remaining 9 values have mean 47, so their sum is \(9 \times 47=423\).
The removed value is \(500-423=77\). Its deviation from the original mean is \(77-50=27\). The removed value was 27 units above the original mean.
Question 8
A set has values: 10, 10, 10, 15, 20.
(a) Mean?
(b) Median?
(c) Mode?
(d) Range?
Solution
The sum of the 5 values= 10+10+10+15+20=65 ⇒ mean= 65/5=13.
The median is the 3rd value in sorted list ⇒ that's 10.
The mode is 10, it appears 3 times.
The range= max-min= 20-10=10.
Question 9
If the mean of 5 consecutive integers is 14, what is the median of those 5 integers?
Solution
5 consecutive integers have a symmetrical distribution, so the mean is also the middle number. That middle number is the median. So the median is also 14. Another approach: The sum is 5×14=70 ⇒ let the 5 consecutive integers be n-2, n-1, n, n+1, n+2 ⇒ their sum= 5n ⇒ so 5n=70 ⇒ n=14 ⇒ so the median is 14.
Question 10
A class of 4 students takes a test: the scores are 70, 80, 85, and x. If the median is 82.5, what are the possible values of x?
Solution
For 4 data points in sorted order, the median is the average of the 2nd and 3rd points. The existing known scores are 70, 80, and 85, plus the unknown score \(x\).
If \(x \ge 85\), the sorted order is 70, 80, 85, \(x\). The middle two values are 80 and 85, so the median is \((80+85)/2=82.5\). This works.
If \(80 \le x < 85\), the sorted order is 70, 80, \(x\), 85. The median would be \((80+x)/2\). Setting this equal to 82.5 gives \(x=85\), which is outside this interval.
If \(x < 80\), the middle two values are \(x\) and 80. Setting \((x+80)/2=82.5\) gives \(x=85\), which is impossible in this case.
Therefore, the possible values are \(x \ge 85\).
Question 11
A sample has data points: 2, 5, 7, 7, 9. Suppose we replicate each data point twice (the new set has each original point repeated 2 times). How does that affect the mean and the median?
Solution
The original mean is (2+5+7+7+9)/5=30/5=6. The median is the 3rd value (in sorted list) ⇒ 7. If we replicate each point, the new set is 10 data points but in the same sorted pattern (just doubled). The mean remains the same (6) because the sum doubles and the number of data points also doubles. The median, as we double them, the middle two values (for 10 points) remain around the central repeated 7. The median remains 7. So neither changes.
Question 12
A set of 10 values has mean 60, standard deviation 5. If each value is multiplied by 3, find the new mean and new standard deviation of the resulting set.
Solution
Multiplying every data value by a constant \(a\) multiplies the mean by \(a\) and multiplies the standard deviation by \(|a|\).
So the new mean is \(3 \times 60=180\), and the new standard deviation is \(3 \times 5=15\).
Question 13
A set of 6 distinct numbers has median 10. If a new number 25 is added and the new median is 11.5, what can you conclude about how many of the original numbers are at least 10?
Solution
Write the original sorted values as \(a_1
Therefore, exactly 3 of the original numbers are at least 10: \(a_4\), \(a_5\), and \(a_6\).
Question 14
The population {3, 5, 5, 7, 10} has standard deviation \(\sigma\). If a new value 3 is appended to form {3, 3, 5, 5, 7, 10}, does the population standard deviation increase, decrease, or stay the same?
Solution
Original set mean is (3+5+5+7+10)/5=30/5=6 ⇒ some spread. Adding 3 adds a data point below the mean, which likely increases the spread overall because we have an additional low value. Generally, adding a data point far from the mean or on one side tends to increase standard deviation. So \(\sigma\) would increase.
Question 15
A sample of 4 data points has standard deviation of 2. If we add 2 to each data point, the new sample standard deviation is what?
Solution
Adding a constant does not change the spread. So the new standard deviation remains 2.
Question 16
A teacher has exam scores: 80, 81, 82, 83, 100. The teacher wants to trim the outlier to measure a "trimmed mean." If the teacher removes the highest score (100), what is the new mean of the remaining 4 scores?
Solution
Remaining scores: 80, 81, 82, 83 ⇒ sum= 326 ⇒ average= 326/4=81.5.
Question 17
The weights (in pounds) of 5 dogs are: 30, 55, 60, 60, 65.
(a) Mean weight?
(b) Mode weight?
(c) If a 6th dog weighs 60 lb, how does that change the mode?
Solution
Sum= 30+55+60+60+65=270 ⇒ mean=270/5=54 lb.
The mode is 60 because it appears twice, more than others.
If a 6th dog is also 60 ⇒ that reaffirms 60 is the mode, with now 3 occurrences.
Question 18
A population is {4, 4, 4, 4}. The standard deviation is 0. If we add one more data point of 4, what is the new standard deviation?
Solution
All data points remain 4 ⇒ no variation ⇒ standard deviation is 0.
Question 19
The median of {2, 5, 6, 7, x} is 6. If x is an integer, what values can x take?
Solution
With 5 data points, the median is the 3rd value after sorting. The known values 2, 5, 6, and 7 already place 6 in the middle unless \(x\) is less than 6. If \(x<6\), then \(x\) would come before 6 and could move 6 out of the 3rd position. If \(x \ge 6\), the sorted set keeps 6 as the middle value.
Therefore, any integer \(x \ge 6\) works: \(6,7,8,9,\ldots\).
Question 20
A dataset is {10, 10, 12, 14, 16, 20, 20}. If a new data point with value 14 is added, what are the new mean, median, and mode?
Solution
The original sum is \(10+10+12+14+16+20+20=102\). After adding 14, the new sum is \(116\) and the new count is 8, so the new mean is \(116/8=14.5\).
The new sorted dataset is 10, 10, 12, 14, 14, 16, 20, 20. The median is the average of the 4th and 5th values: \((14+14)/2=14\). The modes are 10, 14, and 20 because each appears twice.
Question 21
A sample's 6 data values are: 2, 4, 4, 5, 7, 9. If the sample standard deviation is s, what is the population standard deviation \(\sigma\) for these same 6 values?
Solution
Relationship: population std dev uses divisor n, sample std dev uses divisor n-1. So \(\sigma= \sqrt{\frac{n-1}{n}} \cdot s\). Here n=6 ⇒ \(\sigma= \sqrt{\frac{5}{6}} s= s\sqrt{\frac{5}{6}}.\)
Question 22
Suppose we have a mean of 10 for 4 data points. If we add two new points, 15 and 5, how does the mean change?
Solution
Original sum=4×10=40. Adding 15,5 ⇒ new sum=40+15+5=60 ⇒ total 6 points ⇒ new mean=60/6=10 ⇒ so the mean remains 10, because 15+5=20 ⇒ that's exactly 2 times 10 ⇒ no net effect on average.
Question 23
A set of 5 numbers has mean 12 and range 10. If we increase the largest number by 6, how does that affect the mean and range?
Solution
Original sum=5×12=60. The range= largest-min. If we add 6 to the largest, the new sum=60+6=66 ⇒ new mean=66/5=13.2 ⇒ range increases by 6 from the original 10 ⇒ new range=16.
Question 24
The following 4 data points have median 8: {6, 7, x, 14}, in ascending order. If x is an integer, what values can x take for the median to be 8?
Solution
For 4 values, median= average of 2nd,3rd ⇒ (7 + x)/2=8 ⇒ 7+x=16 ⇒ x=9. But also the list must remain sorted as 6,7,x,14 ⇒ so x≥7 ⇒ x≥7 ⇒ but we also have (7+x)/2=8 ⇒ x=9. We check if 9 <14 ⇒ yes ⇒ so x=9 is valid.
Question 25
A set of 10 values has a certain standard deviation \(\sigma\). If we replicate each value once (so the set doubles in size, each data repeated), what happens to \(\sigma\)?
Solution
Repeating each data point does not change the distribution's spread. The standard deviation remains the same. Doubling the sample size in that way does not affect the distances among points; hence \(\sigma\) stays the same.
Question 26
A population is {2, 2, 3, 5, 10}. (a) Mean? (b) Median? (c) Standard deviation if considered population? Round to nearest tenth.
Solution
(a) Mean= (2+2+3+5+10)=22 /5=4.4.
(b) Sorted ⇒ 2,2,3,5,10 ⇒ 3rd is 3 ⇒ median=3.
(c) Use the population formula. The squared deviations from the mean 4.4 are \(5.76, 5.76, 1.96, 0.36,\) and \(31.36\). Their sum is 45.2. The population variance is \(45.2/5=9.04\), so the standard deviation is \(\sqrt{9.04}\approx 3.0\).
Question 27
The mode of {4, 5, 5, 7, 7, x} is 5. If x is an integer, what values can x take to preserve that mode?
Solution
In the set {4, 5, 5, 7, 7, \(x\)}, both 5 and 7 already appear twice. For 5 to be the single mode, it must appear more often than 7.
If \(x=5\), then 5 appears 3 times while 7 appears 2 times. If \(x=7\), then 7 becomes the mode. If \(x\) is any other integer, 5 and 7 remain tied. Therefore, \(x=5\) is the only possibility.
Question 28
7 employees have an average salary of \$50,000. If one additional employee is hired at \$70,000, what is the new average salary of all 8 employees?
Solution
Original sum= 7×50,000=350,000 ⇒ add one at 70,000 ⇒ new sum=420,000 ⇒ new average=420,000 ÷8=52,500.
Question 29
A data set has quartiles Q1=20, Q2=median=30, Q3=40. Suppose one extremely large outlier is added. How does that affect Q1, Q2, Q3 typically?
Solution
A very large outlier affects the maximum, range, and mean most directly. Quartiles are based on position, so \(Q_1\), the median \(Q_2\), and \(Q_3\) often stay the same or change only slightly in a large dataset. In a very small dataset, the exact quartiles can shift because the number of data points changes.
Question 30
Find the mean and median of the set: {1, 2, 4, 9, 16, 25, 25}.
Solution
Sum=1+2+4+9+16+25+25=82 ⇒ number of data points=7 ⇒ mean=82/7 ~11.71.
Sorted ⇒ 1,2,4,9,16,25,25 ⇒ the median is the 4th ⇒ 9.
Question 31
The 5-number summary (Min, Q1, Median, Q3, Max) for a data set is (2, 5, 8, 12, 20). If 20 is replaced by 25, what changes occur to the interquartile range (IQR) and the median?
Solution
The replacement changes only the maximum from 20 to 25. The quartiles and median listed in the 5-number summary remain \(Q_1=5\), median \(=8\), and \(Q_3=12\). Therefore, the IQR remains \(12-5=7\), and the median remains 8.
Question 32
In a dataset of 10 values, the sum of squared deviations from the mean is 90. Find the population standard deviation and the sample standard deviation. Which divisor is used in each case?
Solution
For population standard deviation, divide by \(n\): the variance is \(90/10=9\), so \(\sigma=3\). For sample standard deviation, divide by \(n-1\): the variance is \(90/(10-1)=10\), so \(s=\sqrt{10}\). Use the population formula when the data represent the whole group being studied; use the sample formula when the data are a sample from a larger group.
Question 33
The mode of {x, 4, 4, 7, 9} is 4. If x < 4, does that preserve 4 as the mode? If x=4, what happens?
Solution
If \(x<4\), the value 4 still appears twice while every other value appears once, so 4 remains the mode. If \(x=4\), then 4 appears three times, so 4 remains the mode even more clearly.
Question 34
A sample has data: 1, 2, 5, 8, 10. The mean is 5.2, the sample standard deviation is about 3.6. If we remove the outlier 10, how do mean and standard deviation change?
Solution
Removing 10 lowers the sum and reduces the mean. The new set is 1, 2, 5, 8, with sum 16 and mean 4. The standard deviation decreases because the most extreme high value has been removed and the remaining values are more clustered.
Question 35
A set of 4 numbers has mean 9, median 8.5. The sorted set is a, b, c, d. The median is (b+c)/2= 8.5, sum is a+b+c+d=36. If a=5, find possible values of b, c, d.
Solution
Since the median is 8.5, \((b+c)/2=8.5\), so \(b+c=17\). The total sum is \(4 \times 9=36\). With \(a=5\), we get \(5+b+c+d=36\), so \(5+17+d=36\), which gives \(d=14\).
Therefore \(b\) and \(c\) can be any sorted pair with \(b+c=17\) and \(5 \le b \le c \le 14\). Examples include \(b=8, c=9\) or \(b=7, c=10\). One possible set is {5, 8, 9, 14}.
Question 36
An 8-point data set has mean 20, standard deviation 4. If each data point is increased by 10, then multiplied by 2, find the new mean and standard deviation.
Solution
The transformation is: first add 10, then multiply by 2. Overall, each original value \(x\) becomes \(2(x+10)=2x+20\).
The mean transforms the same way, so the new mean is \(2(20+10)=60\).
The standard deviation is unaffected by adding 10, but it is multiplied by 2 when all values are doubled. The new standard deviation is \(2 \times 4=8\).
Question 37
If the sample {3, 5, 5, 7} has mean 5, find its sample variance \(s^2\). Then find \(s\), the sample standard deviation.
Solution
The deviations from the mean are \(-2, 0, 0,\) and \(2\). The squared deviations are \(4, 0, 0,\) and \(4\), so their sum is 8. For a sample with \(n=4\), divide by \(n-1=3\): \(s^2=8/3\approx 2.6667\). Therefore, \(s=\sqrt{2.6667}\approx 1.63\).
Question 38
A set of 5 numbers has mean 6. If a new number is added that is below 6, how does that affect the new mean?
Solution
Adding a number below the old mean drags the average down ⇒ the new mean is lower than 6.
Question 39
Compute the range and interquartile range for the dataset: 2, 3, 5, 9, 9, 9, 10, 15, sorted in ascending order.
Solution
Range= max-min=15-2=13. The set has 8 data points ⇒ Q1 is average of 2nd and 3rd ⇒ (3+5)/2=4 ⇒ Q3 is average of 6th and 7th ⇒ (9+10)/2= 9.5 ⇒ IQR= Q3-Q1= 9.5-4=5.5.
Question 40
A set is {1, 5, 7, 9, 9, 11, 15}. The median is 9. If we remove 15, what happens to the median of the 6 remaining points?
Solution
Original median is the 4th number ⇒ 9. Removing 15 ⇒ new set {1,5,7,9,9,11} ⇒ 6 points ⇒ median is average of 3rd,4th ⇒ (7+9)/2=8 ⇒ the median decreases from 9 to 8.
Question 41
A large sample has mean 100, standard deviation 10. If each data point is scaled by factor 1/5, find new mean and new standard deviation.
Solution
Scaling by 1/5 ⇒ new mean= (1/5)*100=20 ⇒ new std dev= (1/5)*10=2.
Question 42
The mode of a set is 50, the median is 55, the mean is 60. Is this distribution likely skewed left or skewed right?
Solution
If mode < median < mean, typically the distribution is skewed right (positively skewed). The tail extends to the right, pulling the mean above the median.
Question 43
A set of {6, 6, 6, 7, 8} is expanded by adding a 2. (a) New mean? (b) New median?
Solution
The original sum is \(6+6+6+7+8=33\), so the original mean is \(33/5=6.6\). After adding 2, the new sum is 35 and the new mean is \(35/6 \approx 5.83\).
The new sorted set is {2, 6, 6, 6, 7, 8}. With 6 values, the median is the average of the 3rd and 4th values: \((6+6)/2=6\). The mean decreases, but the median remains 6.
Question 44
The 5-number summary of a data set is min=5, Q1=9, median=12, Q3=15, max=35. If a new very large outlier is introduced (e.g., 1000), how does Q1 and Q3 likely change?
Solution
Typically, Q1 and Q3 remain the same or shift very little if the data set is large. A single outlier in the upper range typically does not drastically shift Q1 or Q3, especially if the sample is large. So Q1=9, Q3=15 likely remain or barely change.
Question 45
The sample {1,3,5,5,5,7} has mean about 4.333..., sample standard deviation s about 2.0. If we remove the outlier 1, what happens to s?
Solution
Removing a low outlier typically decreases the spread, so the sample standard deviation likely decreases.
Question 46
A set of 8 data values has median 10. If we add a new value x=10, how does that affect the median for the 9-value set?
Solution
With 8 data points, the median is the average of the 4th and 5th values. If that average is 10, then the 4th value is at most 10 and the 5th value is at least 10. Adding a new value of 10 places 10 at the middle position of the 9-value set.
Therefore, the new median is 10.
Question 47
The distribution of incomes is right-skewed. Suppose the mean is \$60k, the median \$55k, the mode \$50k. Order them from least to greatest.
Solution
For a right-skewed distribution, \(\text{mode} < \text{median} < \text{mean}\). In this case, \(\$50k < \$55k < \$60k\).
Question 48
If the data are left-skewed, how do mean, median, and mode typically compare?
Solution
Left-skewed, or negatively skewed, data typically follow \(\text{mean} < \text{median} < \text{mode}\). The tail is on the left side, pulling the mean below the median.
Question 49
A set of 6 numbers {2, 4, 4, 6, x, 8}, sorted in ascending order, has median 5. What values can \(x\) take?
Solution
For 6 numbers, the median is the average of the 3rd and 4th values. Here those values are 4 and 6, so the median is \((4+6)/2=5\).
Since the list is sorted in ascending order as 2, 4, 4, 6, \(x\), 8, the value of \(x\) must satisfy \(6 \le x \le 8\). If \(x\) is an integer, then \(x\) can be 6, 7, or 8.
Question 50
The set {10, 12, 14, 16, 18} has mean 14, standard deviation about 2.83. If we transform each x to (x - 14)/2, find the new mean and new standard deviation.
Solution
The transformation is \(x \mapsto (x-14)/2\). The new mean is \((14-14)/2=0\).
Standard deviation is not affected by subtracting 14, but it is divided by 2 when all deviations are divided by 2. The new standard deviation is \(2.83/2 \approx 1.415\).
Conclusion and Final Tips
You have now worked through 50 practice questions focused on core statistical measures: mean, median, mode, and standard deviation. Understanding these fundamental concepts is critical for data-based questions on the SAT. Here are some closing tips:
- Mean, Median, Mode Basics: The mean is sensitive to outliers; the median is more robust. The mode is the most frequent value, which can be non-unique if there is a tie.
- Impact of Transformations: Adding a constant shifts the mean and median but not the standard deviation; multiplying each data point by a constant scales all three major measures of center (mean, median, mode) and also scales standard deviation by the absolute value of that constant.
- Standard Deviation "Zero" Cases: If all values are identical, the standard deviation is zero because there is no spread.
- Quartiles and IQR: The interquartile range (Q3 - Q1) is unaffected by extremes unless the new data changes how many points fall into each quartile. For large data sets, a single outlier typically does not shift quartiles much.
- Skewness Patterns: In a right-skewed distribution, \(\text{mean} > \text{median} > \text{mode}\). In a left-skewed distribution, \(\text{mean} < \text{median} < \text{mode}\). The shape can help you quickly identify ordering of these measures.
- Sample vs. Population SD: On the SAT, you typically will see the distinction if "sample" or "population" is specified. Remember for a population of size n, the variance divides by n; for a sample, we divide by (n-1).
With consistent practice and awareness of these details, you will be well-prepared to handle basic statistics questions on the SAT. Best of luck!