
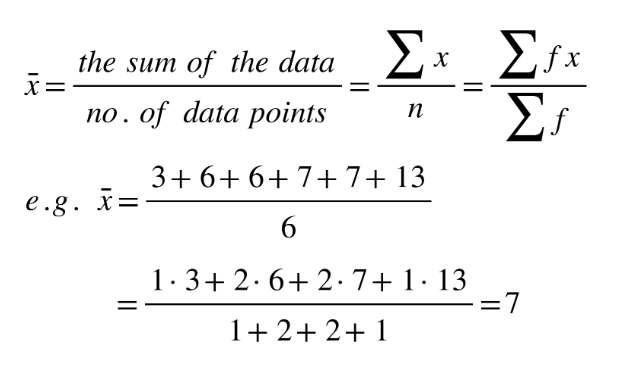
Example data set: 6, 3, 6, 13, 7, 7 in a table:
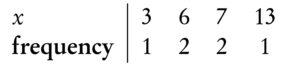
Mean the average value,
Mode the value that occurs most often (highest frequency) e.g. The example data set has 2 modes: 6 and 7
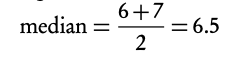
Median the middle value when the data set is ordered low to high. Even number of values: the median is the average of the two middle values. Find for larger values as n + ½ .
e.g. data set from low to high: 3, 6, 6, 7, 7, 13
Range largest x-value − smallest x-value
e.g. range=13−3=10
Variance
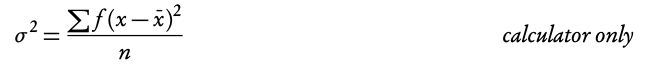
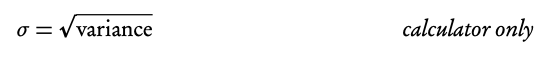
Standard deviation
Grouped data data presented as an interval, e.g.10 < x ≤ 20 where:
- lower boundary = 10
- upper boundary = 20
- interval width = 20 − 10 = 10
- mid-interval value (midpoint) = (20 + 10)/2 = 15
Use the midpoint as the x-value in all calculations with grouped data.
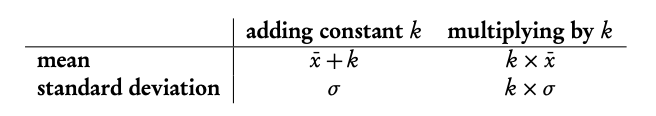
Adding a constant to all the values in a data set or multiplying the entire data set by a constant influences the mean and standard deviation values in the following way:
Q1 the value for x so that 25% of all the data values are ≤ to it first quartile = 25th percentile
Q2 median = 50th percentile
Q3 third quartile = 75th percentile
Q3 − Q1 interquartile range (IQR) = middle 50 percent
Example: Snow depth is measured in centimetres: 30, 75, 125, 55, 60, 75, 65, 65, 45, 120, 70, 110. Find the range, the median, the lower quartile, the upper quartile and the interquartile range.
First always rearrange data into ascending order: 30, 45, 55, 60, 65, 65, 70, 75, 75, 110, 120, 125
- The range
125−30=95cm
2. The median: there are 12 values so the median is between the 6th and 7th value.
(65 + 70) / 2 = 67.5 cm
3. The lower quartile: there are 12 values so the lower quartile is between the 3rd and 4th value.
(55 + 60) / 2 = 57.5 cm
4. The upper quartile: there are 12 values so the lower quartile is between the 9th and 10th value.
(75 + 110) / 2 = 92.5 cm
5. The IQR
92.5 − 57.5 = 35cm