Definitions
Population the entire group from which statistical data is drawn (and which the statistics obtained represent).
Sample the observations actually selected from the population for a statistical test.
Random Sample a sample that is selected from the population with no bias or criteria; the observations are made at random.
Discrete finite or countable number of possible values (e.g. money, number of people)
Continuous infinite amount of increments (e.g. time, weight)
Note: continuous data can be presented as discrete data, e.g. if you round time to the nearest minute or weight to the nearest kilogram.
7.1. Descriptive statistics
For 1 variable data with frequency use 1-Var Stats on GDC.
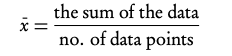
Mean the average value
Mode the value that occurs most often
Median when the data set is ordered low to high and the number of data points is:
- odd, then the median is the middle value;
- even, then the median is the average of the two middle values.
Range largest x-value−smallest x-value
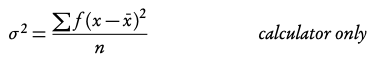
Variance
Standard deviation
Grouped data data presented as an interval. Use the midpoint as the x-value in all calculations.
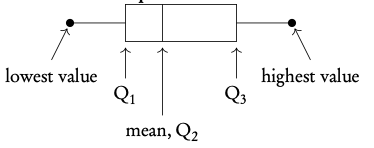
Q1 first quartile = 25th percentile
Q2 median = 50th percentile
Q3 third quartile = 75th percentile
Q3 – Q1 interquartile range (IQR) = middle 50 percent
7.3. Statistical graphs
Frequency the number of times an event occurs in an experiment
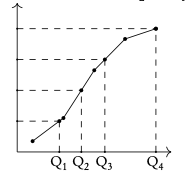
Cumulative frequency the sum of the frequency for a particular class and the frequencies for all the classes below it
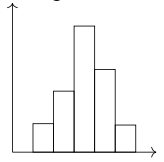
Histogram
Cumulative frequency
7.4. Bivariate statistics
For analysis of data with two variables.
On GDC use LinReg(ax+b).
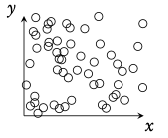
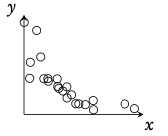
Scatter diagrams
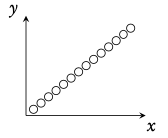
Regression Line (r = ax + b) Can be used to interpolate unknown data.
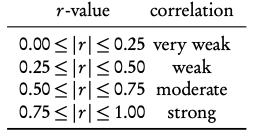
Interpretation of r -values
The correlation between the two sets of data. Can be positive or negative.