
Functions are mathematical relationships where each input has a single output. You have probably been doing functions since you began learning maths, but they may have looked like this:
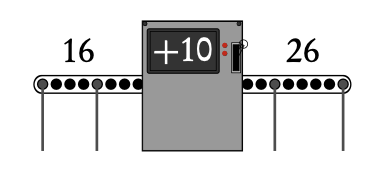
Algebraically this is:
f (x) = x + 10,
here x =16, y =26.
We can use graphs to show multiple outputs of y for inputs x, and therefore visualize the relation between the two. Two common types of functions are linear functions and quadratic functions.
2.1.1 Linear functions
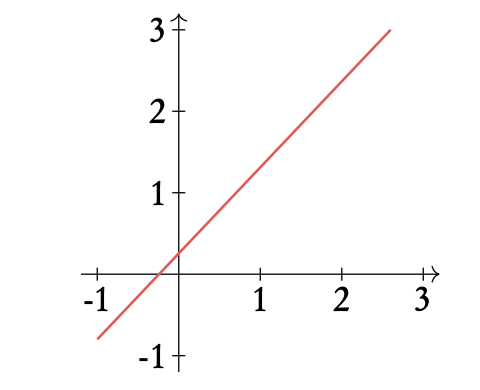
Linear functions y = m x + c increases/decreases at a constant rate m, where m is the gradient and c is the y-intercept
Straight line equations are sometimes written in two other forms, which you should be comfortable rearranging them to and from:
ax + by + d = 0 ⇒ general form
y − y1 = m(x − x1) ⇒ point-slope form
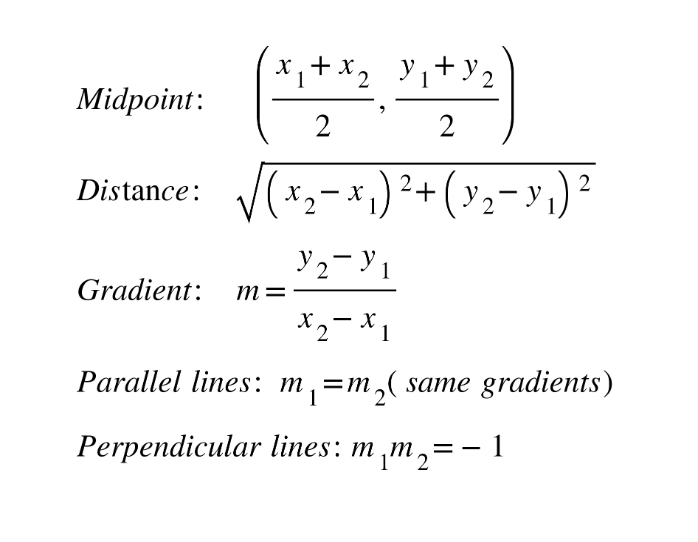
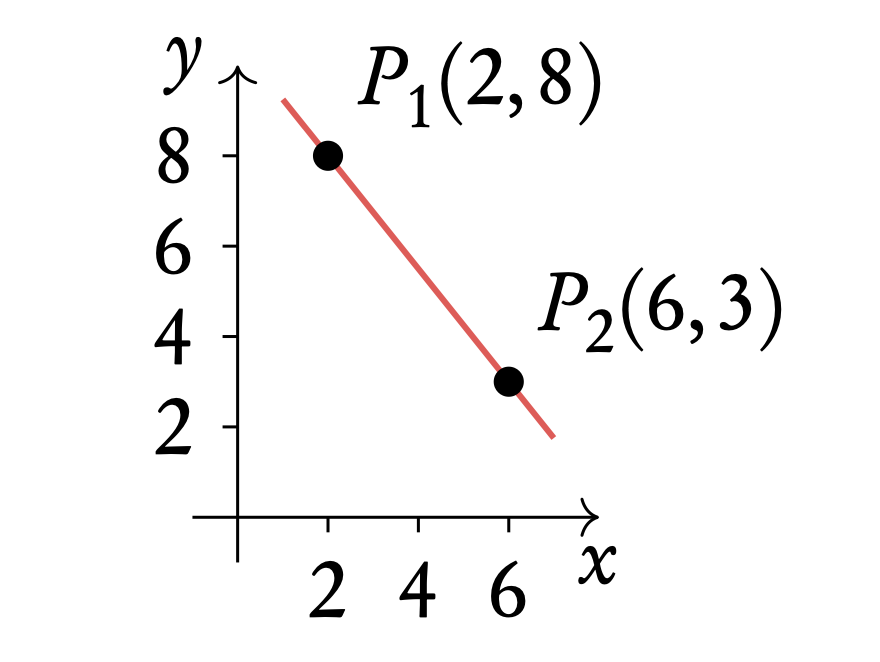
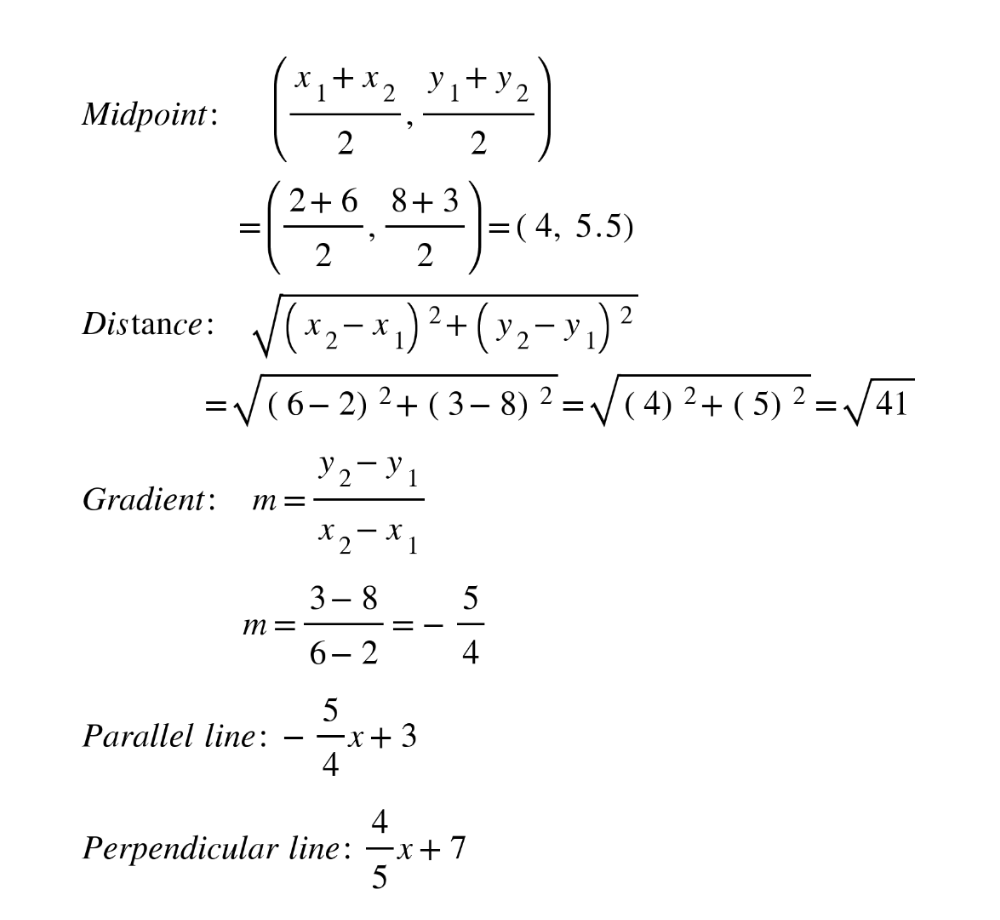
Example: Determine the midpoint, length and gradient of the straight line connecting the two points P1(2, 8) and P2(6, 3)
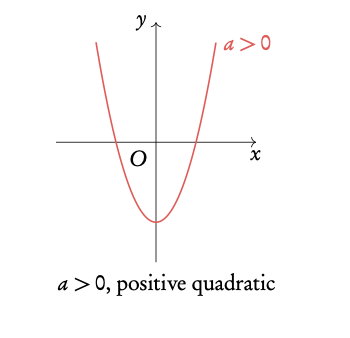
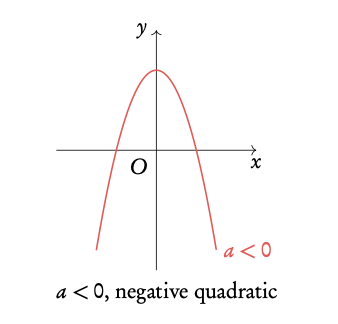
2.1.2 Quadratic functions
Graphed, quadratic functions make a parabolic shape; they increase/decrease at an increasing rate.
Quadratic functions y = ax2 + bx + c = 0
Axis of symmetry x = −b/2a = x−coordinate of vertex
Roots the x-intercept(s). Algebraically, roots can be found through factorisation or using the quadratic formula
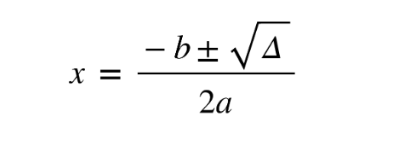
Quadratic formula used to find the roots if a ≠ 1
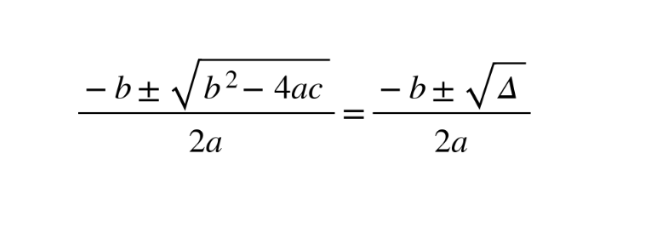
Discriminant ∆ the b2 − 4ac part of the formula, which can be used to determine how many x-intercepts a quadratic equation has
∆ > 0 ⇒ 2roots
∆ = 0 ⇒ 1root
∆ < 0 ⇒ no real roots
Note: Roots of quadratic equations are also referred to as ‘solutions’ or ‘zeros’.
Two more standard ways to write quadratic equations are:
y = a(x − h)2 + k with the vertex at (h, k)
y = a(x − p)(x − q) with x-intercepts (p, 0)(q, 0)
Solving quadratic equations by factorisation
Solve x2 − 5x + 6 = 0
- Set up a system of equations p + q = b and p × q = c
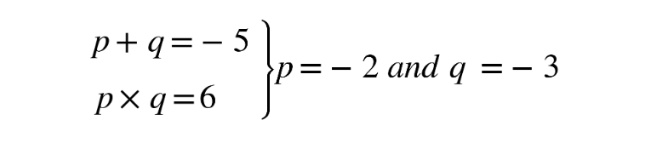
2. Plug the values for p and q into
(x + p)(x + q)
(x − 2)(x − 3) = x2 − 5x + 6
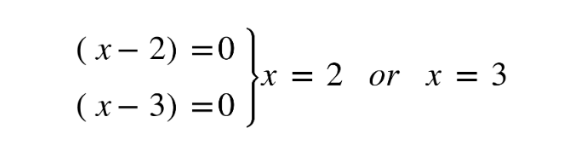
3. Equate each part to 0
(x + p) = 0, (x + q) = 0,
and solve for x
Solving quadratic equations using the quadratic formula
Solve 3x2 − 8x + 4 = 0
- Calculate the discriminant ∆ = b2 − 4ac
∆ = (−8)2 − 4 · 3 · 4 = 16
2. Use the discriminant to determine the number of solutions
∆ > 0 so 2 solutions
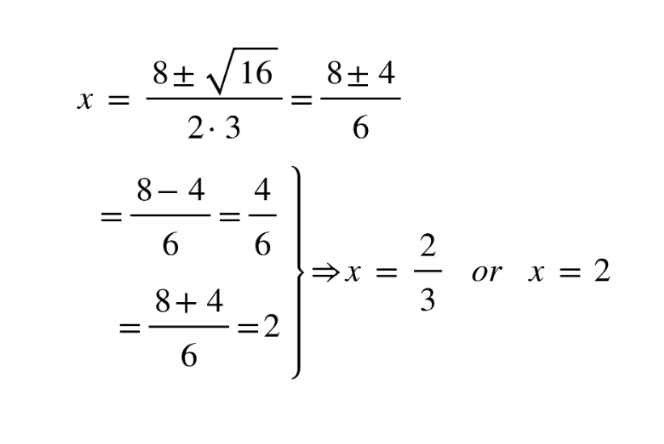
3. Find solutions using quadratic formula
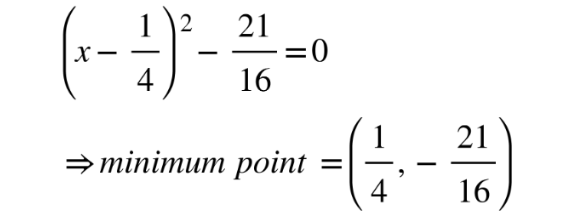
Through a method called completing the square, you can rearrange a quadratic function into the form y = a(x − h)2 + k. This way you can find the coordinates of the vertex (the minimum or maximum). For the exam you will always be asked explicitly to use this method.
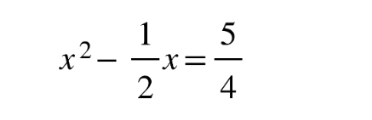
Find the vertex by completing the square
- Move c to the other side
2. Divide by a
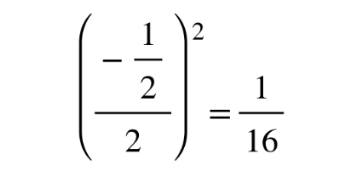
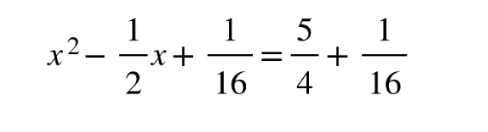
4. Add this term to both sides
5. Factor perfect square and bring constant back
2.1.3 Functions with asymptotes
Asymptote a straight line that a curve approaches, but never touches.
A single function can have multiple asymptotes: horizontal, vertical and in rare cases diagonal. Functions that contain the variable (x) in the denominator of a fraction and exponential and logarithmic functions will always have asymptotes.
Vertical asymptotes
Vertical asymptotes occur when the denominator is zero, as dividing by zero is undefinable. Therefore if the denominator contains x and there is a value for x for which the denominator will be 0, we get a vertical asymptote.
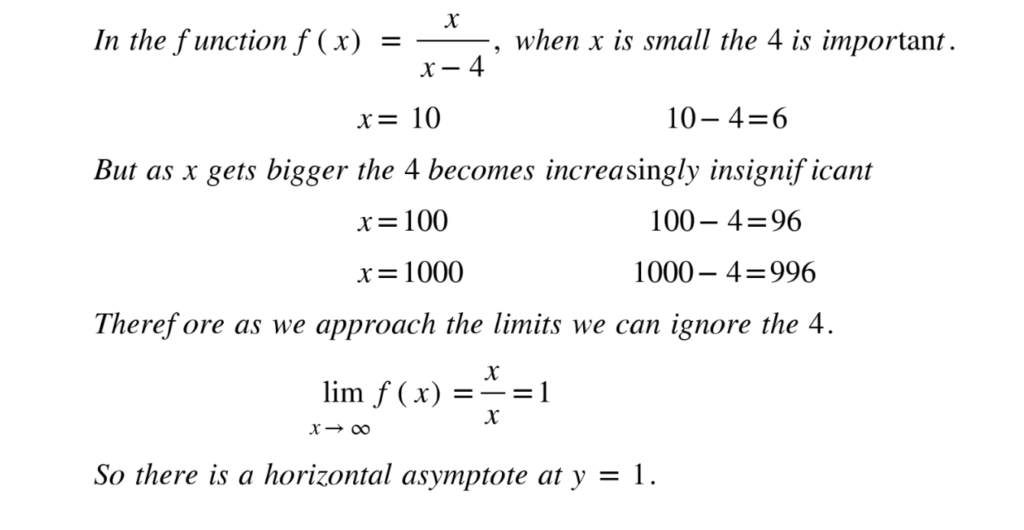
Horizontal asymptotes
Horizontal asymptotes are the value that a function tends to as x becomes really big or really small; technically speaking to the limit of infinity, x → ∞. The general idea is then that when x is large, other parts of the function not involving x become insignificant and so can be ignored.
Example:
Exponential and logarithmic functions
Exponential functions will always have a horizontal asymptote and logarithmic functions will always have a vertical asymptote, due to the nature of these functions. The position of the asymptote is determined by constants in the function.
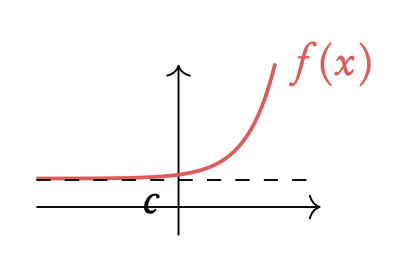
Exponential
f(x) = ax + c asymptote at y = c
where a is a positive number (often e)
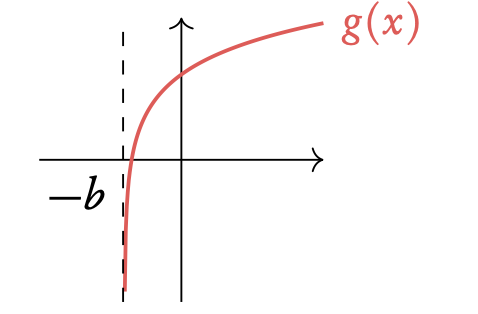
Logarithmic
g(x) = loga (x + b)
asymptote at x = −b
2.1.4 Special Functions
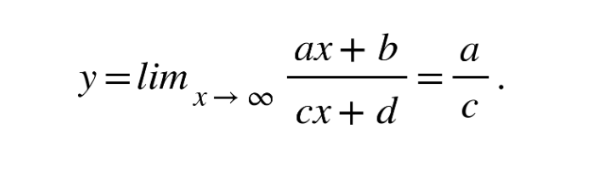
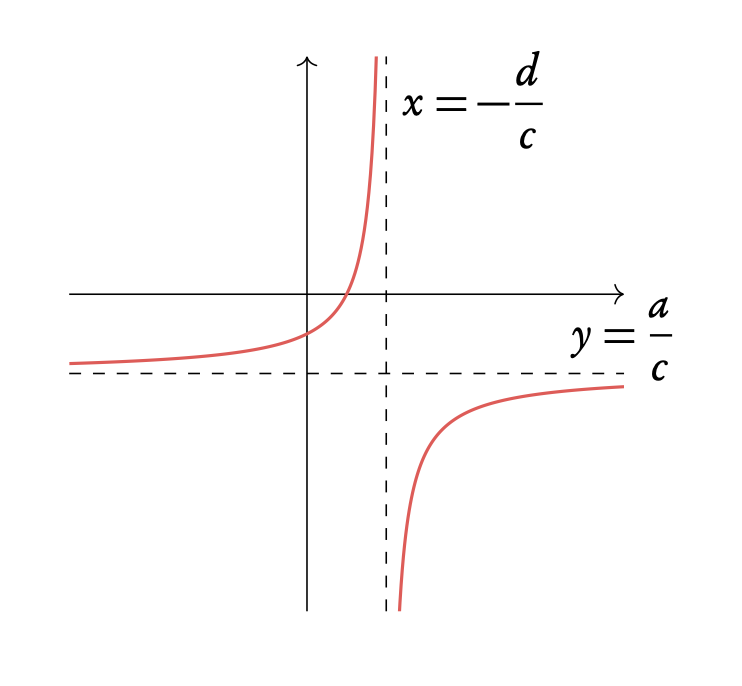
Rational function of the form y = (ax + b)/(cx +d)
The graph made by this function has one horizontal and one vertical asymptote. The graph is not continuous in all points, but splits into two parts. Both of the parts approach horizontal asymptote at either negative or positive large values of x and approach horizontal asymptote at either negative or positive large values of y. Also both parts are located in different “corners” of the coordinate system.
The vertical asymptote occurs where denominator is equal to 0, meaning x = −d/c . The graph is not defined at that point.
The horizontal asymptote occurs at very large values of x, meaning that asymptote occurs at
Frequently Asked Questions: Mathematical Functions
What is a mathematical function?
In mathematics, a function is a rule that assigns to each input value (from a set called the domain) exactly one output value (in a set called the codomain). Think of it like a machine: you put something in, and it gives you a single, specific thing back every time for that input.
It's typically denoted as f(x) = ... , where f is the function name, x is the input variable, and f(x) represents the unique output value for that input x.
How is a function different from a relation?
A relation is simply a set of ordered pairs, showing a relationship between inputs and outputs. A function is a *special type* of relation with a key restriction: **for every input, there is only one output.**
In a relation, an input could potentially be associated with multiple outputs. In a function, this is strictly not allowed.
What are the key parts of a function?
The main components of a function are:
- Domain: The set of all possible input values (often 'x' values) for which the function is defined.
- Codomain: The set of all possible output values. The range is a subset of the codomain.
- Range: The set of all actual output values that the function produces for the given domain inputs.
- Rule/Mapping: The formula or description that dictates how each input is transformed into its unique output.
Why are functions important in mathematics?
Functions are fundamental building blocks in almost all areas of mathematics and science. They are crucial for:
- Modeling real-world relationships where one quantity depends on another (e.g., distance traveled over time, cost based on quantity).
- Analyzing patterns and predicting outcomes.
- Building more complex mathematical concepts like limits, derivatives, and integrals (calculus).
- Representing data visually through graphs.
What are some common types of mathematical functions?
There are many types, often classified by their rule or graph shape. Some common ones include:
- Linear Functions: f(x) = mx + b (straight line graph)
- Quadratic Functions: f(x) = ax² + bx + c (parabola graph)
- Polynomial Functions: Functions involving only non-negative integer powers of x (e.g., x³, 5x² - 2x + 1).
- Rational Functions: Functions that are a ratio of two polynomials (fractions of polynomials).
- Exponential Functions: f(x) = aˣ (variable is in the exponent)
- Logarithmic Functions: The inverse of exponential functions.
- Trigonometric Functions: Functions related to angles (sin, cos, tan, etc.).
How can functions be represented?
Functions can be represented in several ways:
- Algebraically: As an equation (e.g., f(x) = x² + 3).
- Graphically: As a curve or line on a coordinate plane, where each point (x, y) satisfies y = f(x). Graphs are useful for visualizing behavior. The "vertical line test" can determine if a graph represents a function.
- As a Table of Values: A list of input-output pairs (x, f(x)).
- Verbally: A description in words (e.g., "The function that squares a number and adds three").
What does it mean to "evaluate" a function?
Evaluating a function means finding the output value when you are given a specific input value. For example, if f(x) = 2x + 1 , evaluating f(3) means substituting x=3 into the rule: f(3) = 2(3) + 1 = 7. The output for the input 3 is 7.