
Height Percentile Calculator by Age, Sex, and Country
A height percentile calculator helps you place a measured height in context: age, sex-specific growth charts, country or clinical reference choice, and the difference between a single number and a meaningful growth trend. This guide explains how CDC and WHO growth-chart percentiles work, how to measure correctly, how to read z-scores, and when a result should be discussed with a qualified healthcare professional.
Important: Height percentiles are screening and tracking tools, not diagnoses. A calculator can help you understand where a measurement sits on a reference curve, but it cannot judge puberty timing, family height pattern, nutrition, chronic illness, medication effects, or measurement error. If a child is dropping across percentile bands, growing much faster or slower than expected, or has other symptoms, use the result as a reason to ask a clinician for interpretation rather than as a final answer.
What a Height Percentile Calculator Does
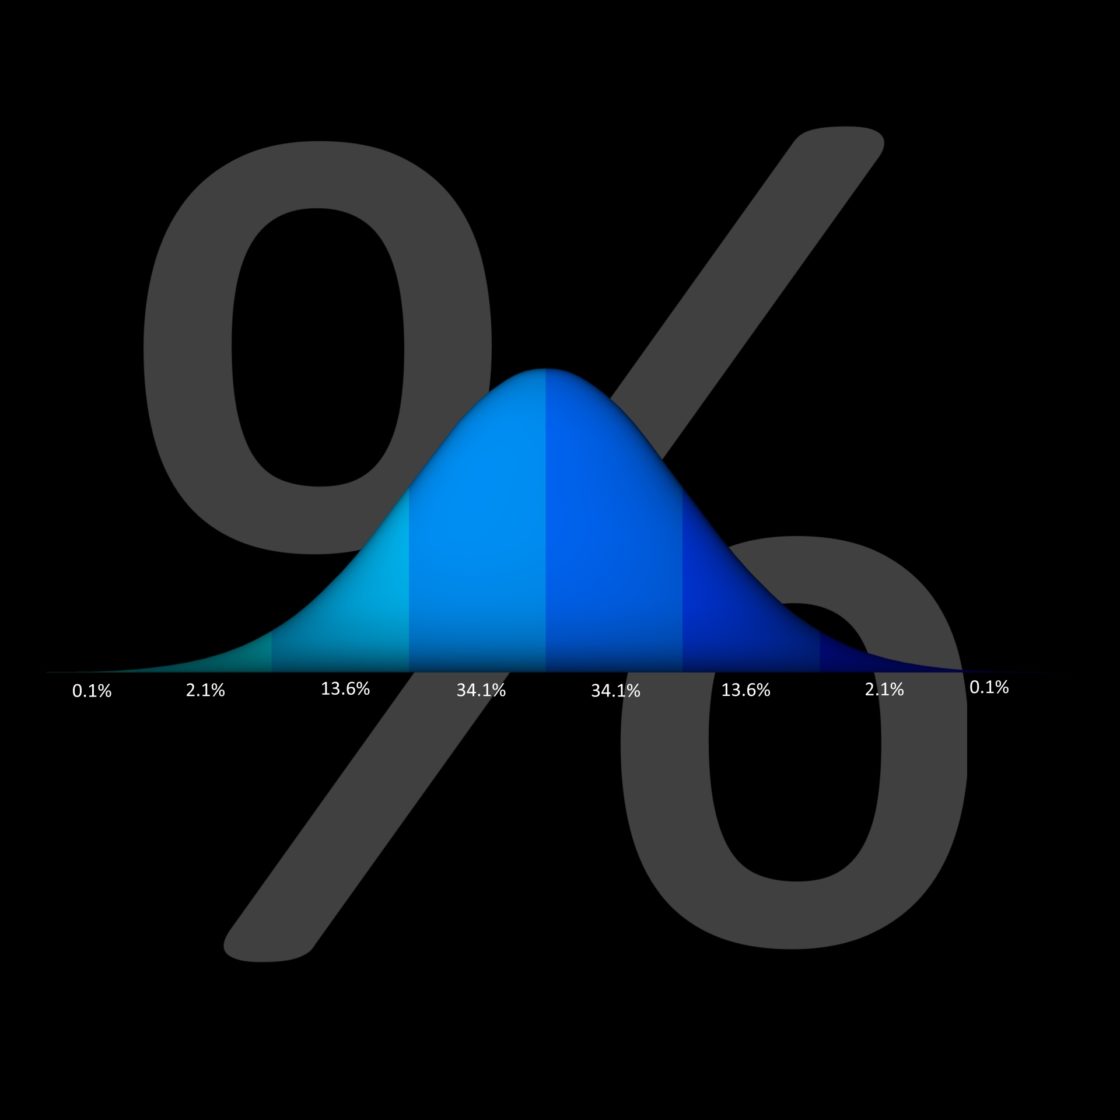
A height percentile calculator compares a person's height with a reference population of the same age and sex. The output is usually a percentile, a z-score, or both. If a child is at the 70th percentile for height, the simple interpretation is that the measured height is taller than about 70 percent of the reference group and shorter than about 30 percent. The percentile is not a grade, not a ranking of health, and not a prediction by itself. It is a way to make height comparable across age groups that grow at very different speeds.
The key advantage of a percentile is context. A 100 cm height has a very different meaning for a 3-year-old, a 5-year-old, and an 8-year-old. A percentile adjusts for that age difference. It also adjusts for the sex-specific growth curves used by CDC and WHO charts. During childhood and adolescence, boys and girls have different median heights and different timing of growth acceleration, especially around puberty. That is why a serious height percentile calculator must ask for age and sex before it can give a useful result.
Country matters because growth references are not all built the same way. In the United States, CDC guidance uses WHO Child Growth Standards for children from birth to 2 years and CDC Growth Charts for children and adolescents from age 2 onward. In other countries, clinicians may use WHO standards, national growth references, or a hybrid of international and local charts. A public calculator should be clear about its reference population rather than implying that one number is universal for every country.
Percentile
A percentile tells you the share of the reference group below the measurement. The 50th percentile is the median, not a target every child must reach.
Z-Score
A z-score tells you how far the measurement is from the reference median in standard deviation units. It is especially useful near the upper and lower ends of a chart.
Growth Trend
One measurement is less useful than a sequence. A steady pattern along a curve usually carries more meaning than a single percentile on one day.
For families tracking a child's growth at home, the calculator is most useful when paired with accurate age and height inputs. If you need a clean way to convert feet and inches to metric units before comparing growth data, the inch to centimeter calculator can help with the unit step. For age precision, a child who is 5 years and 10 months should not be entered as simply 5 or 6. A precise age from a date of birth is better, and RevisionTown's date of birth calculator can be useful before using a growth chart.
CDC vs WHO Growth Charts
CDC and WHO growth charts are both widely used, but they answer slightly different questions and apply to different age ranges in U.S. clinical guidance. The CDC states that WHO Growth Standard Charts should be used for children from birth to 2 years, while the 2000 CDC Growth Charts should be used for children and adolescents from age 2 years onward. The CDC also emphasizes that growth charts contribute to an overall health picture and are not meant to be the only diagnostic instrument.
WHO standards are often described as growth standards because they are based on children growing under defined health and environmental conditions. For infants and toddlers, this makes WHO charts especially valuable because they are designed around how children should grow under supportive conditions. CDC charts for ages 2 to 20 are growth references for U.S. children and adolescents. They show how children in the reference population grew, and they are used continuously across school-age years and adolescence.
The terminology also changes with age. For infants and toddlers younger than 2 years, clinicians usually measure recumbent length, which means the child is measured lying down. For children age 2 and older, the measurement is standing height or stature. A calculator should not treat those as interchangeable without explanation. Recumbent length and standing height differ in method, and the chart used should match the measurement type.
| Age range | Preferred chart in U.S. guidance | Measurement term | Practical note |
|---|---|---|---|
| Birth to 2 years | WHO Child Growth Standards | Length-for-age | Measure lying down using a proper length board when possible. Home measurements can be less precise. |
| 2 to 20 years | CDC 2000 Growth Charts | Stature-for-age or height-for-age | Measure standing height without shoes and use age in months when possible. |
| Adults | Adult population references, not pediatric growth charts | Standing height | Adult height percentile is a population comparison, not a pediatric growth assessment. |
The transition at age 2 deserves careful handling. A child measured lying down at 23 months and then standing at 24 months may appear to shift slightly because the measurement technique changed. This is one reason pediatric growth assessment is usually done over multiple visits. If you are also estimating future adult height, use that as a separate planning question. The child height predictor and pediatric height predictor calculator are better suited for height projection than a percentile-only page.
How to Measure Height Correctly
A height percentile calculator is only as reliable as the measurement entered into it. A small measurement error can move a child several percentile points, especially for infants and young children. The most reliable clinical method uses trained staff and proper equipment. At home, you can still improve accuracy by using a consistent routine and avoiding common mistakes.
For infants and toddlers under 2
Use recumbent length. Lay the child flat on a firm surface, keep the head against a fixed headboard if available, straighten the legs gently, and place the footboard against the heels. A flexible tape measure on a bed is less accurate because the child can bend, twist, or move.
For children age 2 and older
Use standing height. Remove shoes, bulky hair accessories, and hats. The child should stand straight with heels on the floor, head level, and eyes looking forward. A wall-mounted stadiometer is better than a pencil mark on a door frame.
Measurement checklist
- Use the same unit system consistently. Official growth tables are usually in centimeters. If you record height in feet and inches, convert carefully before calculating.
- Measure at a similar time of day when tracking trends. Standing height can vary slightly through the day because of normal spinal compression.
- Repeat the measurement. If two readings differ, measure again and use the most consistent value rather than the tallest or shortest reading.
- Record the exact date. A child measured on January 1 and again on July 1 is not just "the same age plus a little." Growth charts use age in months or finer intervals.
- Do not mix length and standing height on the wrong chart. Recumbent length should be compared with length-for-age references. Standing height should be compared with stature-for-age references.
For older children and adults, unit conversion is often the first source of error. One foot is 30.48 cm and one inch is 2.54 cm. A height of 5 ft 4 in is not 5.4 feet; it is 64 inches, or 162.56 cm. If you need to check a mixed measurement quickly, the feet and inches calculator is a safer step than mental conversion.
Height Percentile Formulas
Official growth-chart calculations commonly use the LMS method. The method summarizes each age-and-sex reference curve with three values: \(L\), \(M\), and \(S\). The \(M\) value is the median. The \(S\) value describes spread. The \(L\) value handles skewness by applying a Box-Cox transformation. Once those values are known for the correct chart, age, and sex, the measured height can be converted into a z-score and then into a percentile.
\(L\): skewness
The \(L\) parameter adjusts for non-symmetry in the distribution. It is part of the transformation that lets measurements be compared with standard normal z-scores.
\(M\): median
The \(M\) parameter is the median height for the chosen age, sex, and reference chart. It corresponds to the 50th percentile.
\(S\): variation
The \(S\) parameter is the generalized coefficient of variation. It describes how spread out the measurements are around the median.
Z-score from height
When \(L \ne 0\), the LMS z-score formula is:
When \(L = 0\), the formula becomes:
In these formulas, \(X\) is the measured height or length in the same unit used by the chart data, usually centimeters. The values \(L\), \(M\), and \(S\) must come from the correct chart table. Using a 10-year-old reference row for a 10-year-and-10-month-old child can produce a different result than using the proper age interpolation.
Percentile from z-score
After calculating \(z\), convert it to a percentile using the cumulative distribution function of the standard normal distribution:
Here, \(\Phi(z)\) means the standard normal cumulative distribution function. A z-score of 0 corresponds to the 50th percentile. A z-score around 1 corresponds to roughly the 84th percentile. A z-score around -1 corresponds to roughly the 16th percentile. Near the extremes, z-scores are often more stable than percentile labels because percentiles bunch together close to 0 and 100.
Height from a desired percentile
Sometimes the task is reversed: you want to know the height at a given percentile curve. If \(z_p\) is the z-score for the desired percentile and \(L \ne 0\), the height is:
If \(L = 0\), the reverse formula is:
Unit conversion formulas
Most height reference data uses centimeters. The common conversion formulas are:
Mid-parental height formula
Height percentile and adult height prediction are related, but they are not the same calculation. A common clinical screening estimate uses mid-parental height. With parental heights in centimeters, the usual formulas are:
This estimate is not a guarantee. Puberty timing, nutrition, chronic illness, endocrine factors, and genetics beyond parental height can all affect final adult height. It is best used as context when comparing a child's percentile pattern with family background.
How to Interpret Results
The most common mistake is treating the percentile as a grade. A child at the 25th percentile is not doing worse than a child at the 75th percentile. Those values simply describe position in a reference distribution. Many healthy children track near the 10th percentile, 50th percentile, or 90th percentile for years. The pattern over time is usually more important than the exact percentile on one visit.
A steady curve suggests that the child's growth rate is broadly consistent with the reference pattern. A large shift may deserve a closer look, especially if it is repeated across measurements taken with good technique. For example, a child who has always tracked near the 40th percentile and is now near the 35th percentile may simply have normal variation or measurement error. A child who moves from the 75th percentile to the 25th percentile across repeated visits may need a clinician to review growth velocity, nutrition, puberty timing, and overall health.
| Result | Plain-language meaning | How to think about it |
|---|---|---|
| Below 3rd or 5th percentile | Shorter than most children in the reference group | May be normal family pattern, but should be interpreted with clinical context, especially if growth velocity is low. |
| 10th to 25th percentile | Below the median but common | Usually less concerning if the child has tracked there consistently and family height supports it. |
| 25th to 75th percentile | Middle range of the reference curve | Often described as broadly average, though the exact percentile still matters less than the trend. |
| 75th to 90th percentile | Above the median but common | Often normal, especially with taller family height or earlier puberty timing. |
| Above 95th or 97th percentile | Taller than most children in the reference group | Usually normal if consistent with family height, but rapid acceleration or symptoms should be reviewed. |
There is also a difference between height percentile and weight-related interpretation. A height percentile says where stature falls for age and sex. It does not say whether weight is appropriate for height. For that, clinicians may review weight-for-length in infants, BMI-for-age in children age 2 and older, or other measures depending on age and context. If you need a separate body size screening calculation, use a dedicated tool such as the body mass index calculator rather than trying to infer weight status from height percentile alone.
Practical reading: A "normal" result is not one perfect percentile. A useful result is one that matches the correct chart, accurate measurement, precise age, sex-specific reference data, and a growth pattern that makes sense over time.
Country and Reference Population Context
The phrase "by country" can mean two different things. First, it can mean the country where the child receives care, because that determines which chart a clinician may use. Second, it can mean comparing a person with a country-specific population distribution. Those are not the same. For pediatric growth, clinical guidelines usually matter more than casual country comparisons.
WHO Child Growth Standards are international standards for young children. CDC Growth Charts are U.S. reference charts and are recommended in U.S. clinical settings for ages 2 to 20. Some countries use WHO charts for certain ages and local references for others. A calculator should make this transparent. If it says "CDC" for a child outside the United States, the result is still a comparison with the CDC reference population, not necessarily the exact chart a local clinician uses.
Adult height comparisons are different again. Adults have generally completed linear growth, so an adult height percentile compares the person with an adult population, often by country, sex, and age band. That is not a growth assessment. It can be interesting, but it does not replace pediatric growth monitoring. Teenagers should not be compared with adult height distributions until growth is complete, because many adolescents are still in puberty or still gaining height.
Use country for chart choice
If you are in the United States, the CDC/WHO split is the expected clinical default. Outside the United States, check whether your clinician uses WHO charts, local national charts, or another reference.
Do not mix references
A 60th percentile on one chart may not equal a 60th percentile on another chart. When tracking over time, try to use the same chart family consistently unless a clinician changes it deliberately.
Country averages are not diagnoses
Being shorter or taller than a country average is not a medical conclusion. Clinical interpretation depends on growth velocity, family pattern, age, puberty, nutrition, and health history.
Worked Examples
The examples below show how to think through calculator inputs and outputs without over-reading a single result. They are educational examples, not medical judgments.
Example 1: A 6-year-old using a CDC stature chart
A child is 6 years and 4 months old, measured standing without shoes. The measurement is 118.2 cm. Because the child is older than 2 years in a U.S. context, the appropriate chart family is the CDC stature-for-age chart for age and sex. The calculator converts the exact age to months, looks up or interpolates the LMS row, calculates the z-score, and converts that z-score into a percentile.
The useful interpretation is not just "the child is at a certain percentile." It is whether the child is following the same curve compared with prior visits. If previous measurements were near the same range, the result may simply describe the child's established growth pattern.
Example 2: An 18-month-old using a WHO length chart
A toddler is 18 months old and measured lying down. Since the child is under 2 years, the correct U.S. clinical default is WHO length-for-age. The measurement should be treated as recumbent length, not standing height. If the toddler was measured standing instead, the value may not match the chart method and should be interpreted carefully.
If the result is lower than expected but the child was wiggling, bending knees, or measured on a soft surface, repeating the measurement with better technique may be more important than reacting to the first number.
Example 3: A teenager near puberty
A 13-year-old may move through percentiles because puberty timing differs widely. A child who enters puberty early may appear to rise on the chart for a period, while a late-maturing child may temporarily look shorter than peers before catching up. This is one reason height percentile should be interpreted with growth velocity and pubertal stage, not just age and height.
If the concern is future adult height rather than current percentile, combine chart interpretation with family height context and, when needed, clinical assessment. A calculator can support the conversation but cannot determine skeletal maturity or diagnose delayed puberty.
Example 4: Adult height comparison
An adult height percentile is a population comparison. It can answer "how tall is this adult compared with adults in the reference group?" It does not answer whether a child's growth is healthy, and it should not be used for teenagers who are still growing. For adults, country-specific averages and distributions may be relevant, but pediatric CDC/WHO growth charts are not the right tool.
If you want to understand the z-score side more deeply, RevisionTown's z-score and probability calculator is a useful companion because it shows how standard normal probabilities connect to percentiles.
When to Ask a Clinician
A height percentile calculator can show you when a measurement is unusually high, unusually low, or changing faster than expected. It cannot explain why. The reason may be harmless, such as family height, constitutional delay, early puberty, late puberty, or measurement error. It may also be related to nutrition, chronic illness, endocrine conditions, genetic syndromes, medications, or other clinical factors. The difference depends on context.
Consider professional interpretation when:
- A child repeatedly plots below the lower percentile curves or above the upper percentile curves and the result does not match family pattern.
- The child crosses two or more major percentile bands over time, especially downward.
- Growth velocity slows noticeably, even if the current percentile is not extreme.
- Height concerns appear with weight changes, fatigue, chronic digestive symptoms, delayed puberty, early puberty, headaches, vision symptoms, or developmental concerns.
- The child was born preterm and corrected age may still matter for interpretation. For preterm infants, the corrected age calculator can help with the age context before clinical review.
Parents sometimes worry when a child is "only" at the 10th percentile or "too high" at the 90th percentile. Those results are often normal when stable and consistent with family pattern. A clinician is most interested in the complete story: birth history, parental heights, nutrition, sleep, activity, chronic symptoms, medications, puberty timing, and multiple measurements over time. A single home-measured percentile should be a prompt for better information, not a reason for panic.
For broader health-related calculators, RevisionTown groups related tools in the health and fitness calculators section. Use those tools for education and organization, and use professional care for diagnosis or treatment decisions.
Best Workflow Before Using a Height Percentile Calculator
A clean workflow prevents most errors. Before entering numbers, decide whether the person is an infant, child, adolescent, or adult. Then decide the reference chart. Then measure carefully. Then convert units if needed. Then calculate. Finally, interpret the result against previous measurements and family context.
- Confirm age precisely. Use date of birth and measurement date. For children, age in months can matter.
- Select the correct sex-specific chart. Growth charts are typically male/female because the reference data are sex-specific.
- Select the chart family. Use WHO for birth to 2 years in U.S. guidance and CDC for age 2 to 20 years in U.S. guidance. Outside the United States, check local practice.
- Measure using the right method. Recumbent length for under 2, standing height for age 2 and older.
- Convert units accurately. Keep centimeters, inches, and feet-plus-inches separate.
- Read both percentile and z-score if available. Percentiles are easier to explain; z-scores are often better for technical interpretation.
- Compare with previous data. Growth trend is more meaningful than one isolated reading.
- Use clinical judgment when results are unexpected. Repeat the measurement and ask a clinician if the pattern remains concerning.
Common Mistakes That Change the Result
Most wrong percentile results come from avoidable input errors rather than complicated statistics. The formulas may be technical, but the practical details are simple: correct age, correct chart, correct measurement, correct unit.
Rounding age too much
Entering a 5-year-11-month child as simply 5 years can compare the child with the wrong part of the chart. In fast-growth periods, that difference matters.
Using adult references for teenagers
Teenagers may still be growing. A 15-year-old should generally be interpreted with pediatric growth charts, not adult population height distributions.
Mixing inches and decimal feet
5 ft 6 in is 66 inches. It is not 5.6 feet. This mistake can create a large conversion error.
Comparing length with stature
Recumbent length and standing height are measured differently. The chart must match the measurement technique.
Overreacting to one point
A single point may reflect measurement error, illness, posture, or timing. Repeated measurements tell the better story.
Ignoring family pattern
A child from a shorter or taller family may naturally track toward the lower or upper percentiles. Family height context matters.
Growth Velocity Matters More Than One Percentile
Growth velocity means the rate at which height changes over time. For a child, velocity often tells the more important story. A single percentile can be affected by measurement error, a recent illness, a rushed home measurement, or an age entry mistake. A sequence of accurate measurements shows whether the child is growing steadily, slowing down, speeding up, or moving through a puberty-related growth spurt.
Clinicians usually look at plotted points across time rather than one isolated number. If a child has tracked near the 20th percentile for several years, that may be a normal personal growth pattern. If the same child moves from the 60th percentile to the 20th percentile across repeated accurate measurements, the question changes. The issue is no longer just "what percentile is this?" but "why did the growth pattern change?" A height percentile calculator can highlight the change, but a clinician interprets the reason.
Velocity is also why measuring too frequently can be misleading. Children do not grow the same amount every day or every week. Home measurements taken every few days may show noise rather than real growth. For many families, a carefully taken measurement every few months is more informative than frequent casual measurements. In a medical setting, the schedule depends on age, health history, and whether there is an existing growth concern.
| Pattern over time | What it may suggest | Practical next step |
|---|---|---|
| Similar percentile band across several visits | The child may be following an established growth curve. | Continue routine measurement and keep records consistent. |
| Small movement up or down | May reflect normal variation, puberty timing, or measurement differences. | Repeat measurements with good technique and compare with the next visit. |
| Repeated downward crossing of major percentile bands | May indicate slowed growth velocity or another issue that needs context. | Discuss with a pediatrician, especially if weight, energy, appetite, or puberty timing also changed. |
| Rapid upward crossing of major percentile bands | May be normal pubertal acceleration or may need review if unusually early or extreme. | Review puberty timing, family height, and symptoms with a clinician. |
| Large shift after switching from length to standing height | May be related to the measurement method transition around age 2. | Confirm which chart and method were used before assuming a true growth change. |
A useful home growth record should include date, age, measurement, unit, method, and notes. A note such as "standing height, no shoes, measured twice" is more valuable than just "116 cm." If a measurement was difficult because the child would not stand straight or because the infant was moving, write that down. Those notes help explain outliers later.
How Interpretation Changes by Age Group
Height percentile interpretation changes as children move from infancy into childhood and adolescence. The same percentile may be read differently depending on age, measurement method, and developmental stage. A calculator that treats every age the same will miss important context.
Birth to 24 months
During the first two years, length changes quickly. Infants may also shift percentiles as feeding patterns, birth size, genetics, and early growth regulation settle. The correct measurement is recumbent length, and the recommended U.S. clinical default is the WHO growth standard. Because infants are hard to measure accurately at home, a small difference in leg position or head position can change the result. For babies, a percentile should be read alongside weight, head circumference, feeding history, gestational age, and corrected age when relevant.
Preterm infants need special care in interpretation. A baby born early may be assessed using corrected age for a period of time, depending on clinical guidance. Without corrected age, the child may appear lower on the chart than expected because the age input does not reflect developmental timing. A calculator can help with arithmetic, but the clinician decides how corrected age should be used.
Age 2 to pre-puberty
After age 2, standing height becomes the normal measurement and CDC stature-for-age charts are commonly used in the United States. Many children settle into a relatively consistent growth channel during these years. That does not mean the percentile is fixed forever, but large repeated shifts are more noticeable. Family height is especially useful here. A child with shorter parents may normally track lower, while a child with taller parents may track higher.
This is also the period when measurement habits become easier to standardize. Remove shoes, use a flat wall or stadiometer, keep the head level, and record exact dates. If the child is old enough, explain that standing straight for a few seconds matters because bending knees or lifting heels can change the result.
Puberty and adolescence
Adolescence is more complicated because puberty timing strongly affects height percentile. Two children of the same age may be at very different stages of development. A teen who starts puberty earlier may rise in percentile temporarily because the growth spurt begins sooner. A late-maturing teen may appear shorter than peers before a later growth spurt. For this reason, a percentile calculator is only one piece of adolescent growth interpretation.
If there is concern about delayed or early puberty, adult height potential, or a sudden change in growth rate, a clinician may consider pubertal stage, family pattern, growth velocity, and sometimes additional evaluation. A calculator cannot assess skeletal maturity, hormone status, or the cause of a growth shift.
Adults
For adults, a height percentile is a population comparison, not a growth chart assessment. Adult height is generally stable after growth is complete, though small changes can occur with posture, spinal compression, aging, and measurement technique. Country comparisons may be more relevant for adults than for children, but the result is descriptive. It says where an adult stands relative to a population distribution; it does not carry the same developmental meaning as a child growth percentile.
What a Responsible Height Percentile Calculator Should Show
A professional calculator should do more than display a number. It should explain which reference chart it used, how it handled age, what measurement type it assumed, and why the result is not a diagnosis. This is especially important for child growth because the wrong chart or unit conversion can make a result look more precise than it really is.
The best calculators are transparent about data. If the calculator uses CDC or WHO growth data, it should say so clearly. If it uses a simplified approximation, it should label the result as an estimate and avoid clinical-sounding certainty. A rough adult height distribution should not be presented as a pediatric growth chart. Likewise, a country dropdown should not imply local clinical accuracy unless the calculator actually uses that country's validated reference data.
Clear input labels
Inputs should ask for exact age, sex-specific chart selection, and measurement unit. For children, the tool should distinguish months from years and should not force users to round heavily.
Chart family disclosure
The output should state whether it used WHO standards, CDC charts, or another reference. This prevents users from comparing results across incompatible chart systems.
Measurement method
The tool should state whether the measurement should be recumbent length or standing height. That instruction should change around the age where chart methods change.
Percentile and z-score
Percentiles are easier for families to understand, while z-scores are useful for technical interpretation. Showing both can make the result more complete.
Trend-focused guidance
The calculator should remind users to compare with previous measurements rather than treating one percentile as a final judgment.
Medical caution
The result should encourage professional interpretation for unexpected patterns, extreme values, symptoms, or major percentile shifts.
A responsible calculator also avoids unnecessary alarm. Words such as "normal" and "abnormal" can be misleading without context. A better approach is to describe the result plainly: below the median, near the median, above the median, near the lower reference curves, or near the upper reference curves. Then the page should explain what additional context matters. This protects readers from both false reassurance and unnecessary worry.
Simple Growth Record Template
If you are tracking a child at home between visits, a structured record is more useful than scattered notes. The goal is not to replace the clinic chart. The goal is to keep measurements organized so that you can discuss them clearly if a question comes up.
| Field | What to record | Why it matters |
|---|---|---|
| Measurement date | Full date, not just month or school year | Exact age is needed for growth-chart comparison. |
| Age | Years and months, or months from birth for younger children | Growth tables are age-specific and may use monthly intervals. |
| Height or length | Centimeters preferred, with original unit if converted | Centimeters reduce conversion mistakes when using official tables. |
| Method | Recumbent length or standing height | The method should match the chart used. |
| Equipment | Stadiometer, wall mark, length board, or other method | Equipment quality affects confidence in the result. |
| Notes | Illness, poor cooperation, shoes removed, repeated reading | Notes explain outliers and help avoid over-interpreting one point. |
Bring the record to routine visits if you have concerns, but remember that clinicians may re-measure using clinical equipment. If the clinic measurement differs from the home measurement, the clinical reading may be more reliable, especially for infants and toddlers. The home record is still useful because it shows what prompted the question.
Why One Number Is Not Enough
A height percentile is useful because it turns a raw measurement into context. It is limited because it cannot explain the cause of a pattern. Two children can both be at the 10th percentile for completely different reasons. One may be following a healthy family pattern with shorter parents. Another may have slowed growth compared with previous measurements. The percentile looks similar, but the interpretation is different.
That is why a calculator result should be read with several other pieces of information: exact age, measurement method, previous growth points, family height, weight pattern, puberty timing, birth history, nutrition, activity, sleep, and any symptoms. The number is a starting point for better questions. It should never be the only evidence used to decide whether growth is healthy or concerning.
Frequently Asked Questions
What is a height percentile calculator?
A height percentile calculator compares a measured height with a reference group of the same age and sex. For children, it usually uses official growth charts such as WHO standards for birth to 2 years and CDC charts for ages 2 to 20 in U.S. clinical guidance. The result tells you what percentage of the reference group is shorter than the measured person.
Is the 50th percentile the "best" height percentile?
No. The 50th percentile is simply the median. It means half the reference group is shorter and half is taller. A healthy child can be at the 10th, 40th, 70th, or 90th percentile. Consistency, growth velocity, family context, and overall health matter more than aiming for the 50th percentile.
What does the 90th percentile for height mean?
The 90th percentile means the measured height is taller than about 90 percent of the same-age, same-sex reference group and shorter than about 10 percent. It often means the child is taller than average, but it does not automatically mean there is a medical issue.
What does the 5th percentile for height mean?
The 5th percentile means the measured height is taller than about 5 percent of the reference group and shorter than about 95 percent. Some healthy children naturally track near the 5th percentile, especially when family height is shorter. However, a low percentile should be interpreted with growth velocity, prior measurements, and clinical history.
Should I use CDC or WHO charts?
In the United States, CDC guidance recommends WHO Child Growth Standards for birth to 2 years and CDC Growth Charts for children and adolescents age 2 and older. Other countries may use WHO charts, national references, or local clinical guidelines. If your clinician uses a specific chart, use the same chart when tracking over time.
Can a calculator predict adult height?
A height percentile may provide context, but it is not a complete adult height prediction. Adult height depends on genetics, puberty timing, nutrition, health conditions, and other factors. Mid-parental height formulas and pediatric height predictor tools can support estimates, but they still have uncertainty.
Why does the calculator ask for sex or gender?
Most CDC and WHO growth charts are sex-specific because male and female growth patterns differ. In practical use, choose the chart that matches the medical record or the clinician's guidance. If there is uncertainty, a healthcare professional can help choose the most appropriate reference for interpretation.
How often should height be measured?
Pediatric measurement schedules vary by age and clinical context. Infants are measured frequently during well-child care. Older children are often measured at routine checkups. At home, measuring too often can create noise because small errors look meaningful. For most home tracking, consistent measurements every few months are more useful than frequent casual measurements.
Can nutrition affect height percentile?
Nutrition can affect growth, especially when deficiencies or chronic health problems are present. Height changes usually reflect longer-term growth, while weight can change more quickly. If height percentile drops along with weight concerns, fatigue, digestive symptoms, or other health issues, professional review is appropriate.
Are height percentiles the same in every country?
No. A percentile depends on the reference population. WHO standards, CDC charts, and national references are built from different datasets and may produce different percentiles. Always identify which chart the calculator uses before comparing results.
Official Sources Used
This page was checked against official CDC and WHO resources on July 9, 2026. The key points used here are that CDC recommends WHO standards from birth to 2 years, CDC charts from age 2 onward in the United States, growth charts are tools that contribute to an overall health picture, and LMS data tables are used to calculate exact percentiles and z-scores.