
Probability distribution a list of each possible value and their respective probabilities.
Expected value E(X) = ∑xP(X = x)
DB 4.7
We can take any of the examples above and create a probability distribution from them. It is important to define the factor X for which the probability applies. Once tabulated we can use the distribution to find the expected value. It is best to think of this as the average value you would get if you repeated the action many times.
Probability distributions
- Draw a sample space diagram
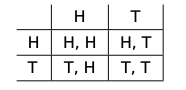
2. Tabulate the probability distribution

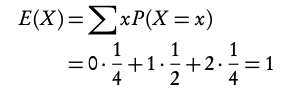
So if you toss a coin twice, you expect to get heads once.
6.3.1 Distribution by function
A probability distribution can also be given by a function.
The domain of X must be specified, as the sum of the probabilities must equal 1.
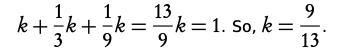
Probability distribution by function
- Use the fact that ∑P(X = x) = 1

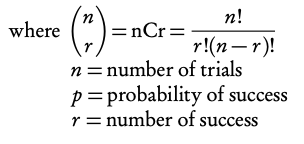
6.3.2 Binomial distribution
Binomial distribution X ∼ B(n, p) used to find probabilities in situations with only 2 possible outcomes and lots of trials
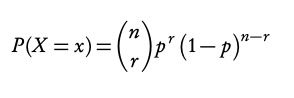
You can calculate values using binomial expansion from the algebra chapter. However binomial distribution questions are often found on calculator papers.
For questions asking for the probability of an exact outcome, P (X = r ), we use Binompdf on the GDC.
For questions asking for the probability of several consecutive values, P (X ≤ r ), we use Binomcdf on the GDC.
Note that Binomcdf only calculates P (X ≤ r ) or in words “at most the value of r ”. Therefore you must remember to transform the function depending on the wording in the questions:
- “Less than r” P(X < r) = P(X ≤ r − 1)
- “More than r” P(X > r) = 1 − P(X ≤ r)
- “At least r ” P(X ≥ r) = 1 − P(X ≤ r − 1)
6.3.3 Normal distribution
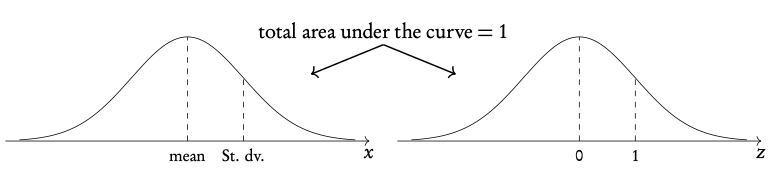
A normal distribution is one type of probability distribution which gives a bell-shape curve if all the values and their corresponding probabilities are plotted.
We can use normal distributions to find the probability of obtaining a certain value or a range of values. This can be found using the area under the curve; the area under the bell-curve between two x-values always corresponds to the probability for getting an x-value in this range. The total area under the normal distribution is always 1; this is because the total probability of getting any x-value adds up to 1 (or, in other words, you are 100% certain that your x-value will lie somewhere on the x-axis below the bell-curve).
Note: Even though you will be using your GDC to find probabilities for normal distributions, it’s always very useful to draw a diagram to indicate for yourself (and the examiner) what area or x-value you are looking for.
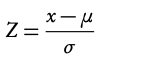
Notation: X ∼N(μ, σ2)
Transform to standard N:
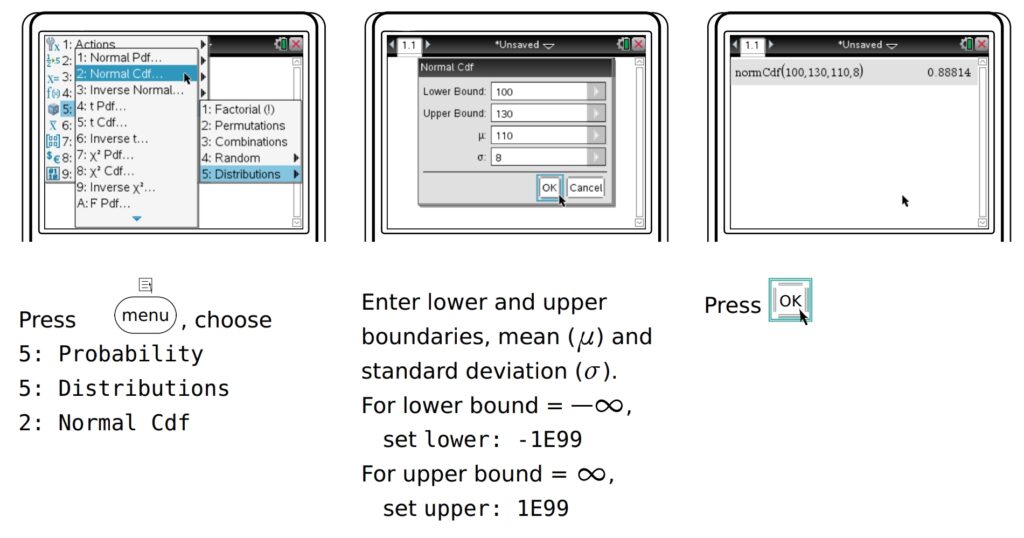
On calculator:
normcdf (lower bound, upper bound, mean (= μ), standard deviation (= σ ))
invnorm (area, mean (= μ), standard deviation (= σ ))
Finding a probability or percentage using normal distribution
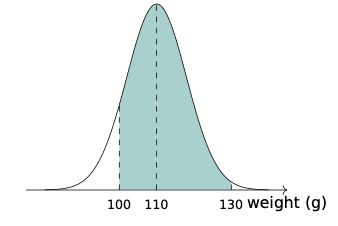
The weights of pears are normally distributed with mean = 110g and standard deviation = 8g. Find the percentage of pears that weigh between 100g and 130g
Sketch!
Indicate:
- The mean = 110g
- Lower bound = 100g
- Upper bound = 130g
- And shade the area you are looking to find.
The weights of pears are normally distributed with mean = 110 g and standard deviation = 8g. 8% of the pears weigh more than m grams. Find m.
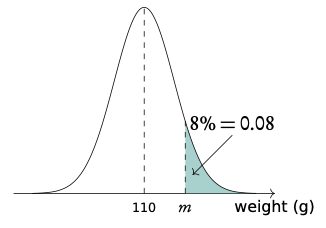

So m = 121, which means that 8% of the pears weigh more than 121g.
- Write down equations
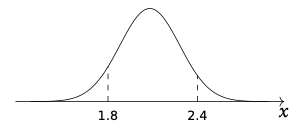
P(L < 1.8) = 0.08
P(L > 2.4) = 0.055
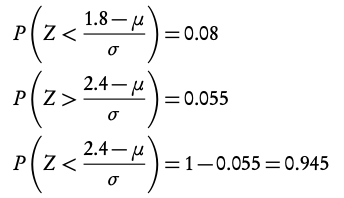
invnorm (0.08, 0, 1) = −1.4051
invnorm (0.945, 0, 1) = 1.5982
5. Equate and solve
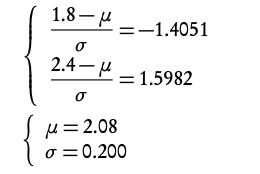
Note: Here you are solving a pair of simultaneous equations. For a review see the Prior Knowledge section.