
Microeconomics & Macroeconomics
| Microeconomics | Macroeconomics |
| It is the study of markets & sections of the economy, rather than the economy as a whole. | It is the study of economic behaviour & decision making in the economy instead of individual markets. |
| Decision Makers | |
|
|
Market System
This refers to the method of allocating scarce resources through market forces of demand & supply.
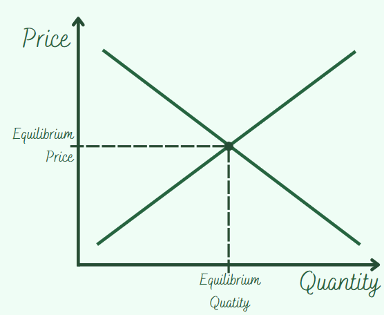
Market Equilibrium
This is the point on a demand-supply graph where the demand curve intersects with the supply curve.
Market Disequilibrium
This occurs when the price of a product is…
- Too high meaning high supply yet low demand.
- Too low meaning high demand yet low supply.

The 3 Questions
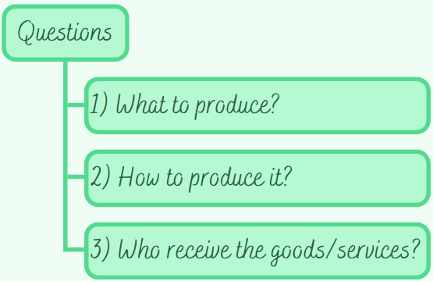
The Price Mechanism
This refers to the system of relying on the market forces of demand & supply to allocate resources.
The private sector is what answers the 3 questions.
Features
- No government intervention.
- Goods & services are allocated on basis of price.
- Goods & services are sold to the people who are able to and willing to pay.
- Factor allocation is based on financial returns.
- Competition increases innovation in products, quality, and competitive prices.
Demand
Demand refers to the willingness & ability to pay a certain price to purchase a good or service.
Demand increases as the product’s price decreases:

Reasons For This Relationship…
1. Decrease in price of good/service causes real income of customer to rise meaning the customer can buy the more goods with the same salary due to low prices.
2. Decrease in price of product means more customers can pay for it and it is likely that they may purchase it.
Determinants of Demand

Trends & Fashion
Products in fashion experience high demand unlike those which are unfashionable.
Price of Compliments:
Compliments are products which are jointly demanded.
If price of a product increases, the demand of the compliment decreases.
Price of Substitute:
Substitutes are products which can be used instead of each other.
If the price of the product falls, the demand of the substitute will also fall.
Income:
Higher income means customers are willing to pay for more goods & services.
Advertising:
Marketing messages which are used to promote, inform, persuade customers to buy from a particular firm.
Government Policies:
Rules & regulations like taxes imposed on certain goods.
Economy:
Demand depends on the state of the economy.
Specifics:
These are other factors which only affect certain goods (like weather conditions or population demographics).
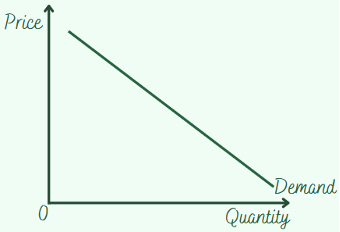
Price & Demand
On the graph, the demand is shown as a line with a negative gradient.
The graph shows the inverse relationship between demand & price.
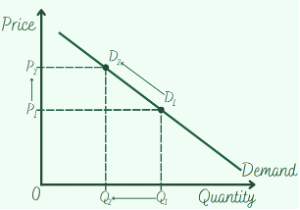
Movements Along the Demand Curve
Market Demand:
This is the sum of the demand of all individuals for a certain product.
Extension & Contraction
Extension:
This is when there is an increase in the quantity demanded due to a decrease in the price.

Contraction:
This is when there is a decrease in the quantity demanded due to an increase in the price of the product.
Shifts in Demand
Shift to Right (Increase):
This is when there is an increase in demand.
You can interpret this as an increase in the quantity demanded without any change in price.

Shift to Left (Decrease):
This is when there is a decrease in demand.
You can interpret this as a decrease in the quantity demanded without any changes in the price.

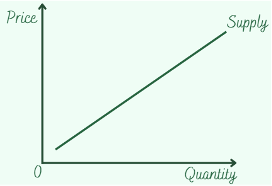
Supply
Supply is the willingness and ability of firms to provide goods & services at the given price levels.
As the price for the product increases, the supply also increases:
𝑆𝑢𝑝𝑝𝑙𝑦 ∝ 𝑃𝑟𝑖𝑐𝑒
Reasons For the Relationship:
1. Existing firms can earn higher profits by increasing supply
2. New businesses have more incentive to join the industry if the high prices can help cover production costs.
Determinants of Supply

Time:
Shorter time period means the suppliers have shorter time to increase the supply meaning lower supply and vice versa.
Weather:
This is only applicable to certain goods. Agricultural goods are better off in good weather conditions as opposed to bad weather conditions.
Opportunity Cost:
The price of a product acts as an indicator for how much a supplier should supply.
If the price for a product increases, suppliers are likely to increase the supply due to higher returns.
Taxes:
Taxes cause the cost of production of a product to increase. This can cause suppliers to reduce supply for a product.
Innovations
Innovation increases supply as technological advancements cause higher levels of output at all price levels.
Production Costs:
As the cost of production increases, the supply decreases, and the supply curve shift to the left.
However, if the opposite happened, the supply increases and the supply curve shifts to the right.
Subsidies:
These are usually given to firms to decrease production cost and increase quantity supplied.
Price & Supply
The law of supply shows us the relationship between the price & the quantity supplied of a product:
𝑆𝑢𝑝𝑝𝑙𝑦 ∝ 𝑃𝑟𝑖𝑐𝑒
This relationship can be shown on a graph as:
Movements Along the Supply Curve
Market Supply:
This is the sum of all supply at all price levels.
Extensions & Contraction
Extension:
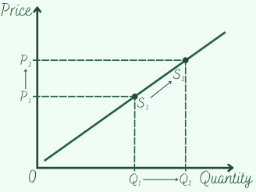
This is caused by an increase in price which results in the quantity supplied to also increase.
Contraction:

This is caused by a decrease in price which results in a decrease in quantity supplied.
Shifts in Supply
Increase in Supply

This is caused by a positive change in supply (increase) which causes a rightward shift of the curve.
This is usually done by a positive change in any non-price factors which affect the supply of a good or service.
Decrease in Supply:

This is caused by a negative change in supply (decrease) which causes a leftward shift of the curve.
This is usually done by a negative change in any non-price factors which affect the supply of a good or service.
Price Changes
Causes & Consequences
Changes Due to Change in Supply
Price Decrease:
Example would be good weather conditions causing increase in supply and fall in price:

Price Increase:
Example would be the imposition of sales tax which causes fall in supply and increase in price:

Changes Due to Change in Demand
Price Decrease:
Example would be with negative publicity which would decrease the demand and cause the price to fall:

Price Increase:
Example would be with better advertising which would increase demand for a product and cause the price to increase:

Note: These are just examples, we can use any change which causes the supply/demand to increase/decrease.
Price Elasticity of Demand (PED)
Definitions
Price Elasticity of Demand (PED):
This measures the extent to which demand for a product changes due to a change in price for that product.
Price Inelastic Demand:
This is when the demand for a product is unresponsive to any changes in price, this is usually due to the lack of substitutes for the product.
PED for this is less than 1.
Price Elastic Demand:
This describes demand for a product being responsive to changes in price, this is usually due to the availability of substitutes for the product.
PED for this is more than 1.
Perfectly Price Inelastic Demand:
This is when a change in price has no impact on the quantity demanded.
PED for this is 0.
Perfectly Price Elastic Demand:
This is when a change in price causes quantity demanded to become 0.
PED for this is ∞ (infinity).
Unitary Price Elasticity Demand:
This is when the percentage change in quantity demanded is proportional to the change in price.
PED for this is 1.
Calculation of PED
We can use the following formula to calculate the PED of a product:

Interpreting Demand Curve Diagrams & PED
Price Inelastic Demand

Price Elastic Demand

Perfectly Price Inelastic Demand

Perfectly Price Elastic Demand

Unitary Price Elasticity Demand

Determinants of PED
Substitution:
The more the number of substitutes are present for a good or service, the higher the PED and vice versa.
Income:
The larger the proportion of income that the price of a product represents, the higher the PED.
Cost of Switching:
Products with high switching costs tend to have low PED as opposed to ones with low switching costs.
Addictions:
PED of products which cause addiction tend to be low as addicts are willing to pay higher prices for the products.
Hobbies:
People who are devoted to their hobbies are willing to pay for their hobbies despite an increase in price meaning the demand is somewhat inelastic.
Trends:
Trendy items tend to have low PED (inelastic demand) (we all know the reason).
Necessity:
Products which are essential are usually price inelastic unlike luxury items which tend to be price elastic.
This depends according to the timeframe, necessity for some items become essential due to certain events (like Christmas trees on Christmas).
Advertising:
Effective advertising can cause PED to decrease.
Brand Loyalty:
Loyal customers are willing to pay for products from a brand despite a price increase.
Time:
Demand tends to be elastic in big time frames as consumers have lots of time to find alternatives. In shorter time frames, the demand is usually inelastic with reasons depending on the product (car owners may rethink decisions due to higher fuel prices in a large time frame but would still use the current car in the small time frames).
Durability:
Products with low durability have low PED as opposed to products with high durability.
Product Definition Size:
This refers to how broadly the products are defined. Products which cover many things like food or housing are price inelastic as they have no alternatives. However, we can specify the product (like apples or milk bread), this increases the PED as the product may have alternatives.
PED & Total Revenue
Sales Revenue/Total Revenue:
This is the sum of the money received from the sale of a good/service and is calculated with the formula:
𝑆𝑎𝑙𝑒𝑠 𝑅𝑒𝑣𝑒𝑛𝑢𝑒 = 𝑃𝑟𝑖𝑐𝑒 × 𝑄𝑢𝑎𝑛𝑡𝑖𝑡𝑦 𝐷𝑒𝑚𝑎𝑛𝑑𝑒𝑑
𝑇𝑅 = 𝑃 × 𝑄
Profit:
This is the difference between the total revenue and the total cost:
𝑃𝑟𝑜𝑓𝑖𝑡 = 𝑇𝑜𝑡𝑎𝑙 𝑅𝑒𝑣𝑒𝑛𝑢𝑒 − 𝑇𝑜𝑡𝑎𝑙 𝐶𝑜𝑠𝑡
𝑃𝑟𝑜𝑓𝑖𝑡 = 𝑇𝑅 − 𝑇𝐶
The Relationship Table:

PED & The Decision Makers
Helping Decide Pricing Strategies:
This is because firms which have inelastic demand are likely to increase prices to get more revenue as opposed to firms with elastic demand. PED helps firms decide the way they would price products for maximum revenue.
Predicting Impact on Producers Due to Changes in Exchange Rates:
Assuming that exports are price elastic, we would know that firms which rely on exports would benefit due to low exchange rates as exports become cheaper and more price competitive.
Price Discrimination:
This is when firms charge different consumers with different prices for basically the same good/service because of differences in PED.
Deciding Which Products to Impose Sales Taxes on:
The government can gain large sums of tax revenue by taxing products which have price inelastic demand without causing any serious changes in demand for the product.
Producers must decide how much of the tax is to be passed onto the customers, this is also easy as they are willing to pay higher prices.
Determining Taxation Policies:
Governments can use PED to set taxation policies for products.
They are likely to impose high taxes on demerit goods knowing that they are price inelastic as they are harmful to society and the quantity demanded can only be decreased when prices are extremely high.
Price Elasticity of Supply (PES)
Definitions
Price Elasticity of Supply (PES):
This measures the responsiveness of the quantity supplied to a change in a product’s price.
Price Inelastic Supply:
This is when the quantity supplied is relatively unresponsive to the changes in price.
PES for this is less than 1.
Price Elastic Supply:
This is when the quantity supplied is responsive to changes in price.
PES for this is more than 1.
Perfectly Price Inelastic Supply:
This is when any change in price has no impact on the quantity supplied.
PES for this is 0.
Perfectly Price Elastic Supply:
This is when quantity supplied can change without any change in price.
PES for this is ∞ (infinity).
Unitary Price Elasticity Supply:
This is when the percentage change in quantity supplied matches the percentage change in price.
PES for this is 1.
Calculating PES
We can use the following formula to calculate the PES of a product:

Interpreting Supply Curve Diagrams & PES
Price Inelastic Supply

Price Elastic Supply

Perfectly Price Inelastic Supply

Perfectly Price Elastic Supply

Unitary Price Elasticity Supply

Determinants of PES
Spare Productive Capacity:
Firms with lots of spare productive capacity can easily increase supply without changing production costs meaning that the supply is relatively price elastic.
Level of Stocks:
The higher the level of stocks of finished goods which are ready for sale, the higher the PES.
Number of Producers in the Industry:
The higher the number of suppliers present in an industry, the more the price elasticity of supply tends to be.
Time Period:
Supply is more price elastic in the long run as firms have lots of time to adjust production unlike in the short run where supply is likely to be price inelastic or less price elastic.
Ease & Cost of Factor Substitution:
This refers to the extent to which it is possible to introduce factor resources (labour & capital). The PES of a product where we can easily introduce labour & capital is usually high. On the contrary, the PES of a product is high when the cost of introducing labour & capital is high or the production process is not flexible.
PES & The Decision Makers
Firms
Firms can become more responsive to changes in the market price by:
- Creating spare production capacity.
- Keeping large inventories and lots of stock.
- Improve storage systems to increase product life.
- Adopting or upgrading to the latest technology.
- Improving distribution systems.
- Developing and training employees to increase labour occupational mobility.
Government
The government can use PES to see how well they complete the macroeconomic goals, and it may also act as a sort of pointer to what they can do to achieve the macroeconomic aims.
PES in labour markets can help explain difference in wages and may cause governments to encourage inflow of migrant workers to relieve any labour shortages and improve PES.
Market Economic System
This economic system relies on the market forces of demand & supply (in the private sector) to allocate resources with little to no government intervention.
Advantages & Disadvantages
| Advantages | Disadvantages |
| Competition helps firms and private individuals pay attention to consumer wants, this increases innovation. | Firms and individuals do not care about environment, this increases pollution and can cause climate change. |
| Individuals can choose what goods/services they purchase or which career they persue as there are no government regulations to stop them. | Firms may use unneeded resources and may exploit consumers through various methods, this means that products may not always be safe for consumers. |
| Profit motive of firms & the possibility that individuals can have infinite wealth creates incentive to work hard, this boosts economic growth and living standards. | Rich have more economic freedom and choice. Production is made to meet the needs & wants of the rich, this can cause basic needs of the poor to be ignored. |
| Businesses compete by decreasing prices and having high quality goods meaning the consumers enjoy goods/services at low cost yet high quality. | Public facilities like defence, street lighting, government hospitals will not be provided as consumer wellbeing is not considered (thrown out the window lol). |
Market Failure
This is when the demand and supply market forces fail to efficiently allocate resources and cause external costs or external benefits.
The 3 Types of Costs
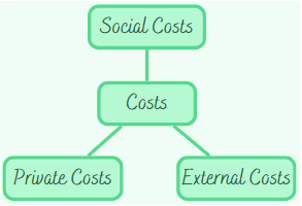
Private Costs
The private costs of production & consumption of a product are the actual costs of a firm/individual/government.
External Costs
These are the negative side effects (or slipover effects) of production & consumption of a product incurred by third parties (parties not involved in the process) for which no compensation is paid.
Social Costs
These are the true costs of the production & consumption of a product to society.
Social costs can be calculated using the following formula:
𝑆𝑜𝑐𝑖𝑎𝑙 𝐶𝑜𝑠𝑡𝑠 = 𝑃𝑟𝑖𝑣𝑎𝑡𝑒 𝐶𝑜𝑠𝑡𝑠 + 𝐸𝑥𝑡𝑒𝑟𝑛𝑎𝑙 𝐶𝑜𝑠𝑡𝑠
The 3 Types of Benefits

Private Benefits
The private benefits of production & consumption of a product are the benefits enjoyed by a firm/individual/government.
External Benefits
These are the positive side effects of production & consumption of a product incurred by third parties (parties not involved in the process) for which nothing is paid by the beneficiary.
Social Benefits
These are the true benefits of the production & consumption of a product to society.
Social benefits can be calculated using the following formula:
𝑆𝑜𝑐𝑖𝑎𝑙 𝐵𝑒𝑛𝑒𝑓𝑖𝑡𝑠 = 𝑃𝑟𝑖𝑣𝑎𝑡𝑒 𝐵𝑒𝑛𝑒𝑓𝑖𝑡𝑠 + 𝐸𝑥𝑡𝑒𝑟𝑛𝑎𝑙 𝐵𝑒𝑛𝑒𝑓𝑖𝑡𝑠
Causes & Consequences
Public Goods
In the free market, the private sector is not able to provide public goods due to the lack of the profit motive.
Public goods are the goods & services which are non-excludable and non-rivalrous meaning that people can enjoy them without paying.
Merit Goods
Merit goods are goods which create positive side-effects and are a social benefit, yet there is a lack in supply and consumption without government intervention.
Both private and public sectors provide these goods.
Demerit Goods
These are goods & services which cause negative side-effects in an economy and are a cause of market failure as they are overproduced & overconsumed if there is no government intervention.
Abuse of Monopoly Power
In a monopoly market, we have only one producer in an industry with many buyers.
This can cause market failure as these firms can exploit their power by charging high prices or reducing supply (this is without government intervention).
This is due to the lack of competition causing them to be inefficient.
Factor Immobility
This can cause market failure because the free market is unable to efficiently allocate resources if the factors (labour and capital) are immobile.
This is covered in more detail in unit 1.
Mixed Economic System
This is an economic system which is a combination of both, a planned economy, and a market economy.
The Planned Economic System (Cuz I Forgot lol) …
This is an economic system which relies on the public sector to allocate resources.
Going Back to Mixed Economies…
The government is who decides how much the public and private sector are involved in the economy.
Maximum Prices
This is a price control method where the government sets the price below the market equilibrium price to make products affordable and encourage consumption (increase demand).
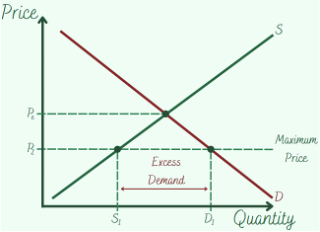
This policy is also used to protect the consumer’s interest from soaring prices.
The problem is that these ceilings distort the market forces & result in the inefficient allocation of scarce resources.
This can be solved through government intervention or the opening of unofficial or parallel markets.
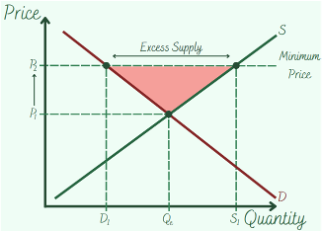
Minimum Prices
This is when the government sets the price above the market equilibrium price to encourage the production of that product (increase supply).
Government Intervention & Market Failure
There are many ways in which the government tries to solve or prevent market failure, these are:
- Maximum Prices
- Minimum Prices
- Indirect Taxation
- Subsidies
- Rules & Regulations
- Privatization
- Nationalization
- Direct Provision of Goods & Services
Indirect Taxation

This is when the government imposes indirect tax on demerit goods to reduce their demand.
In the graph, we see that an indirect tax causes the supply to shift from S1 to Smax, this causes price to increase from P1 to P2 which causes the quantity demanded to decrease from Q1 to Q2.
Advantages & Disadvantages
| Advantages | Disadvantages |
| It increases price which should cause the quantity demanded to decrease. | Demand for these goods is inelastic meaning there is little impact on quantity demanded. |
| It generates tax revenue which can be used for other purposes like subsidies or project funding. | These taxes are regressive and will affect low-income earners more than high income earners. |
Subsidies
A subsidy is a form of financial assistance given to firms by the government to cut their production costs.
Subsidies help encourage the consumption of certain goods & services as they help cut the firm’s production costs leading to a decrease in prices.

In the graph, the subsidy reduces production costs and causes the supply to shift to the right (S1 to S2). Since production cost decreased, so does the price (P1 to P2) and the quantity demanded increases form Q1 to Q2.
Rules & Regulations
The government can impose rules and regulations to solve market failure. Examples of some rules and regulations:
- Laws to restrict smoking in public places and age groups which can purchase them.
- Regulations to ensure that children are vaccinated against diseases.
- Laws making it illegal to drink and drive or eat and drive.
- Motorcyclists made to wear helmets and drivers made to wear seatbelts.
Advantages & Disadvantages
| Advantages | Disadvantages |
| Consumption of certain goods & services may be reduced. | Restrictions cause illegal markets to sell the products at a high price. |
| Awareness of the effect of demerit goods can help change the behaviour of consumers in the long run. | The government cannot control the quality of the products sold in the illegal markets making them dangerous. |
| Awareness of the effect of merit goods is raised. | People break rules and there must be heavy fines and punishments to decrease the incentive. |
Education
This is not education in the school sense but education as in informing the public about something (from raising awareness to encouraging consumption).
Governments insist schools to educate the students about the dangers of demerit goods and encourage them to have healthy habits like eating healthy or having a balanced diet.
Governments also use informative advertising to increase the demand of merit goods like fruits and vegetable (as they are good for health).
Privatization
This is the transfer of the ownership of assets owned by the public sector to the private sector.
Advantages & Disadvantages
| Advantages | Disadvantages |
| Helps reduce debt from the money from sale and tax revenue. | There is an opportunity cost: public interest and facilities or efficiency? |
| Efficient because of profit motive. | May create a private sector monopolist. |
| Reduces cost for taxpayers as they do not need to finance the operation costs. | Private sector does not care about public meaning that they need regulations. |
Nationalization
This is the purchase of private sector assets by the government.
This can help protect employment and promote economic stability.
Direct Provision
This is when the government is who distributes the goods and services.
Usually, this is done for “free” (kidding, nothing is free, the consumers pay through indirect & direct taxes).
Advantages & Disadvantages
| Advantages | Disadvantages |
| The goods & services are accessible to all citizens regardless of status or income. | People may use the free goods & services without paying taxes (tax evasion) |
| The consumption of these goods & services have private benefits to the consumer and external benefits to third parties. | The products may be over consumed causing long queues & shortages. |
| In shortages, it is hard to decide who gets to (and who doesn’t) use the free goods & services. |