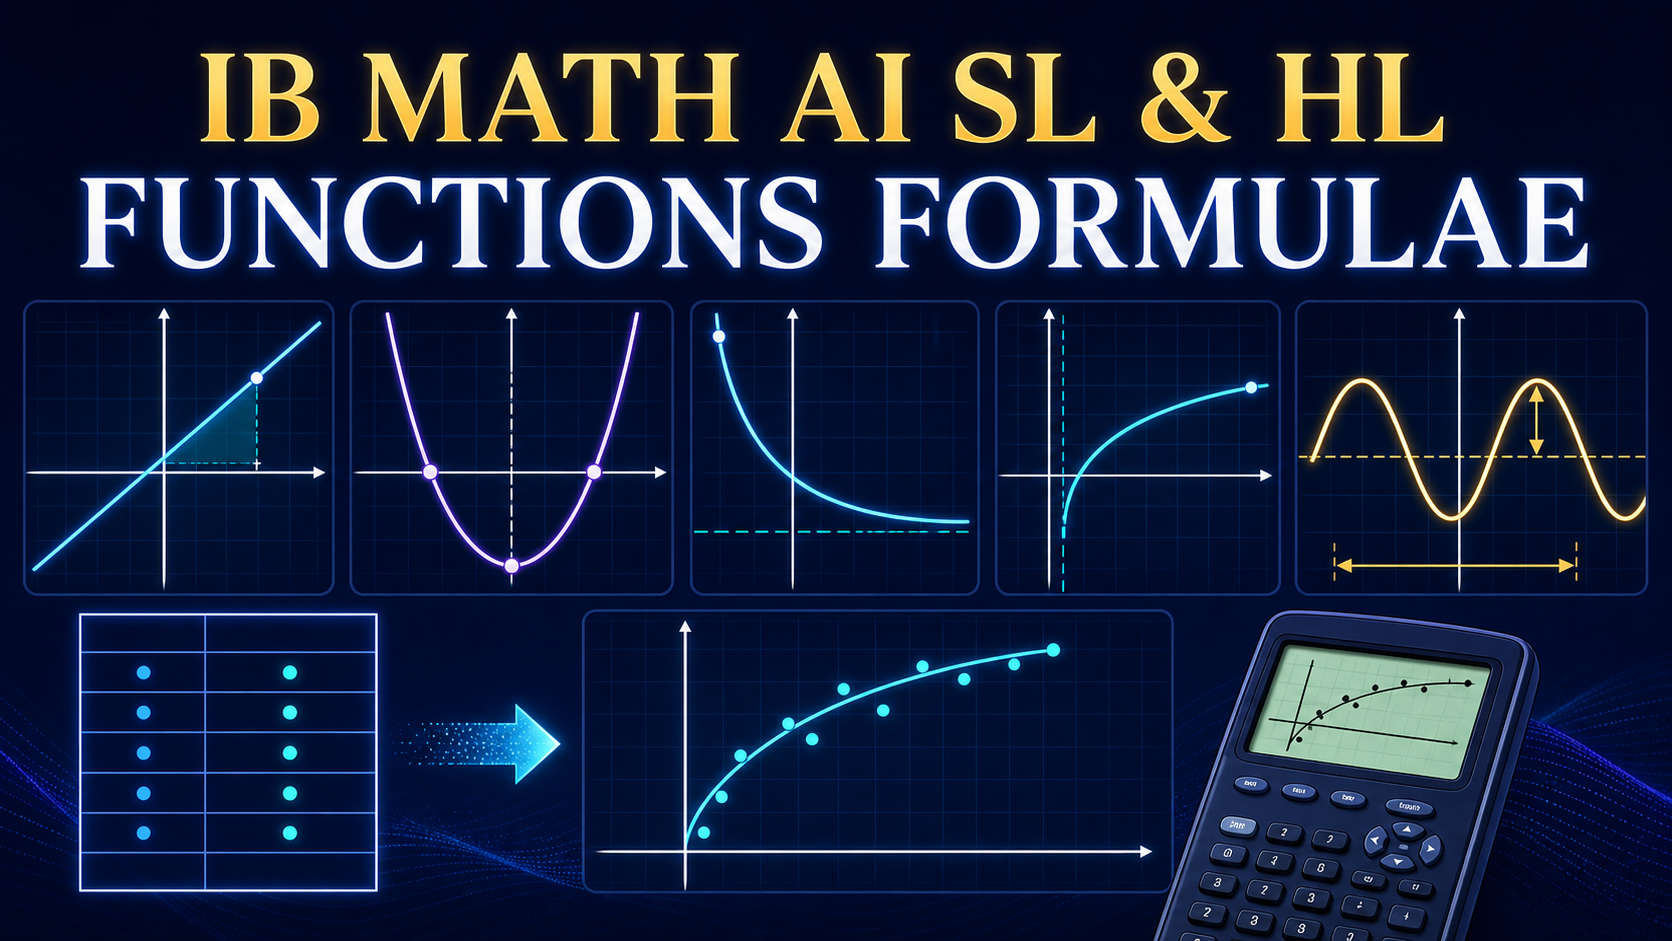
IB Mathematics: Analysis and Approaches
Functions Formulae for AA SL & AA HL
A complete guide to the shared Functions content: straight lines, function language, graphs, composition, inverses, quadratics, reciprocal functions, exponentials, logarithms, equation solving and transformations.

What Functions content is shared by AA SL and AA HL?
Functions provide a language for describing how one quantity depends on another. In IB Mathematics AA, that language connects algebra, graphs, modelling and calculus. An SL student needs the entire SL 2.1-2.11 sequence, and an HL student needs the same sequence before moving to the AHL extension. “Shared” therefore does not mean optional or elementary: these skills appear throughout both courses and often form the first stage of a multi-topic problem.
| Current syllabus section | Essential content | What you should be able to do |
|---|---|---|
| SL 2.1 | Straight lines, gradients and intercepts | Move between line forms; identify parallel and perpendicular lines |
| SL 2.2 | Function, domain, range, graph and informal inverse | Interpret notation and decide whether an inverse can exist |
| SL 2.3 | Graphs and accurate sketches | Label axes and key features; use technology appropriately |
| SL 2.4 | Maximum, minimum, intercepts, symmetry, zeros and asymptotes | Read features and find intersections using technology |
| SL 2.5 | Composite, identity and inverse functions | Calculate compositions and find an inverse with a valid domain |
| SL 2.6 | Quadratic functions in three useful forms | Read intercepts, roots, axis and vertex; change form |
| SL 2.7 | Quadratic equations, inequalities and discriminant | Choose factorization, completing the square or formula; classify roots |
| SL 2.8 | Reciprocal and linear-over-linear rational functions | Find vertical and horizontal asymptotes and intercepts |
| SL 2.9 | Exponential and logarithmic functions | Use inverse relationships, graphs and models |
| SL 2.10 | Analytical and graphical equation solving | Select an exact method or technology and interpret solutions |
| SL 2.11 | Translations, reflections and stretches | Sketch single and composite transformations in the correct order |
The IB guide encourages technology throughout Functions, but technology is not a substitute for structure. You should predict what a graph must do, choose a suitable window, identify important values and communicate the conclusion. A calculator answer without an equation, interval or interpretation is rarely a complete mathematical argument.
Function language: notation, domain, range and inverse
A function assigns exactly one output to every permitted input. The notation f(x) names the output produced when the input is x. It does not mean f multiplied by x. Other letters can describe a context: v(t) might give velocity at time t, while C(n) might give the cost of producing n items.
The domain is the set of allowed inputs. The range is the set of outputs actually produced. A formula may impose its own natural restrictions: a real square root requires a non-negative radicand, a denominator cannot be zero and a real logarithm requires a positive argument. A problem can also impose a contextual domain, such as integer n≥0 for a number of tickets.
Worked example: domain and range
Let f(x)=√(7−2x). For real outputs, 7−2x≥0, so x≤7/2. The square root is never negative, and it can take every value from 0 upward. Therefore the domain is (−∞,7/2] and the range is [0,∞). Notice that the inequality reverses when division by −2 is performed.
An inverse function reverses the original assignment. Graphically, f and f−1 reflect in the line y=x. The domain of the inverse equals the range of the original, and the range of the inverse equals the original domain. A functional inverse exists only when the relevant domain makes f one-to-one. The superscript −1 means inverse, not reciprocal: f−1(x) is generally not 1/f(x).
Straight-line formulae and methods
A straight line has constant gradient. You should recognize three standard forms and choose the one that reveals the information needed by the question.
Gradient-intercept form
m is the gradient and (0,c) is the y-intercept.
Point-gradient form
Best when a point and gradient are known.
General form
Useful when collecting terms or comparing equations.
Gradient through two points
Defined only when the x-coordinates differ.
Parallel non-vertical lines have equal gradients: m1=m2. Perpendicular non-vertical lines satisfy m1m2=−1. Equivalently, a perpendicular gradient is the negative reciprocal. Treat vertical lines separately: x=a has undefined gradient and is perpendicular to the horizontal line y=b.
Worked example: perpendicular line
Find the line through (4,−1) perpendicular to 3x−2y+7=0. Rearranging gives y=(3/2)x+7/2, so the given gradient is 3/2. The perpendicular gradient is −2/3. Point-gradient form gives y+1=−(2/3)(x−4). This may be left in point-gradient form or rearranged to 2x+3y−5=0.
In a context, gradient has units. A distance-time graph has gradient measured in distance per time; a cost-output graph may have currency per item. State those units and interpret the sign. A negative gradient is not merely a descending drawing: it means the output decreases by a fixed amount for every one-unit input increase.
How to sketch and read a function graph
A sketch communicates structure rather than pixel-perfect scale. Label both axes, show intercepts and asymptotes, mark turning points when known and draw the correct end behavior. The command draw usually expects greater accuracy than sketch, but neither permits missing labels or impossible shapes.
For any unfamiliar function, inspect it in this order:
- Domain: identify forbidden or restricted inputs before drawing.
- Intercepts: set x=0 for the y-intercept and solve f(x)=0 for x-intercepts.
- Symmetry: compare f(−x) with f(x) and −f(x) when useful.
- Critical features: locate vertices, maxima, minima, discontinuities and asymptotes.
- End behavior: decide what happens as x becomes very large positive or negative.
- Check: use technology with a window that includes every predicted feature.
The zeros of f are the x-values at which the graph crosses or touches the x-axis. A solution of f(x)=g(x) is the x-coordinate of an intersection between the two graphs. If the question asks when f(x)≥g(x), the answer is an interval or union of intervals where the graph of f lies on or above the graph of g, not just a list of intersection coordinates.
Composite, identity and inverse functions
A composite function applies one rule and then another. In (f∘g)(x)=f(g(x)), the function g acts first because its output becomes the input of f. Order matters: f∘g is usually different from g∘f. The domain must also work at both stages: x must belong to the domain of g, and g(x) must belong to the domain of f.
Worked example: composition and domain
Let f(x)=1/(x−3) and g(x)=x²+1. Then (f∘g)(x)=1/(x²−2), so x≠±√2. In the reverse order, (g∘f)(x)=1/(x−3)²+1, whose domain is x≠3. The formulas and restrictions are different.
The identity function is I(x)=x. A function and its inverse compose to the identity on their appropriate domains:
To find an inverse algebraically, write y=f(x), interchange x and y, solve for y, then state the inverse domain. If the original graph fails the horizontal-line test, restrict its domain before finding an inverse.
Worked example: restricted inverse
Take f(x)=(x−2)²+5 with domain x≥2. Write y=(x−2)²+5. Because x−2≥0, x−2=√(y−5), so x=2+√(y−5). Therefore f−1(x)=2+√(x−5), domain x≥5. Choosing the negative square-root branch would contradict the original restriction.
Quadratic functions: forms, roots and discriminant
A non-degenerate quadratic has a≠0 and a parabolic graph. Its three forms reveal different features.
| Form | Feature visible immediately | Best use |
|---|---|---|
| f(x)=ax²+bx+c | y-intercept (0,c) | Discriminant and quadratic formula |
| f(x)=a(x−p)(x−q) | Roots p and q | Zeros, sign and factored equations |
| f(x)=a(x−h)²+k | Vertex (h,k) and axis x=h | Range, transformations and optimization |
The sign of a determines whether the parabola opens upward or downward. The axis of symmetry is x=−b/(2a), and substituting this value gives the vertex. Completing the square converts standard form to vertex form; factorization converts to root form when real factors exist.
- Δ>0: two distinct real roots.
- Δ=0: one repeated real root; the parabola touches the x-axis.
- Δ<0: no real roots; the graph does not meet the x-axis.
Worked example: choose the useful form
For f(x)=2x²−8x+3, complete the square: f(x)=2(x−2)²−5. The vertex is (2,−5), the axis is x=2 and the range is f(x)≥−5. For roots, use the formula: x=[8±√(64−24)]/4=2±√10/2. The standard, vertex and exact-root information now agree.
A quadratic inequality asks where the graph is positive, negative, above or below a level. Find all boundary roots, place them on a number line and test intervals. Include a root when equality is allowed. Do not write “between the roots” automatically: a downward-opening quadratic has the opposite sign pattern to an upward-opening one.
Reciprocal and linear-over-linear rational functions
The reciprocal function f(x)=1/x, x≠0, has vertical asymptote x=0 and horizontal asymptote y=0. It is self-inverse and has rotational symmetry of order two about the origin. Its branches never touch either asymptote.
For the shared rational family
the vertical asymptote is x=−d/c when c≠0, and the horizontal asymptote is y=a/c. Find the x-intercept from ax+b=0 and the y-intercept by substituting x=0, provided those inputs are valid. These four features normally determine a reliable sketch.
Worked example: rational graph features
For r(x)=(2x−5)/(x+3), the domain excludes −3, so x=−3 is the vertical asymptote. The leading-coefficient ratio gives horizontal asymptote y=2. The x-intercept is (5/2,0), and r(0)=−5/3 gives the y-intercept. Rewriting r(x)=2−11/(x+3) shows the translated reciprocal structure and helps place the branches.
AA HL students later extend rational functions to higher-degree forms with possible oblique asymptotes. Keep that additional material separate from the shared linear-over-linear family so that the method requested by the question remains clear.
Exponential and logarithmic functions
An exponential function has the variable in the exponent. For f(x)=ax with a>0 and a≠1, the domain is all real numbers and the range is positive. It passes through (0,1). If a>1 it grows; if 0<a<1 it decays. The line y=0 is a horizontal asymptote.
The logarithm logax is the inverse of ax. Its domain is x>0, its range is all real numbers, it passes through (1,0), and x=0 is a vertical asymptote. The natural exponential ex and natural logarithm ln x form an important inverse pair.
Useful logarithm laws for positive M and N are:
Every logarithmic step must respect positive arguments. Extraneous or invalid solutions can appear after algebraic rearrangement, so substitute solutions into the original equation.
Worked example: exponential equation
Solve e2x−5ex+4=0. Let u=ex, noting u>0. Then u²−5u+4=0, so (u−1)(u−4)=0. Thus ex=1 or 4, giving x=0 or ln 4. The substitution works because the equation is quadratic in ex.
Growth and decay models
A common model is Q(t)=Q0at, where Q0 is the initial value and a is the multiplication factor per time unit. The continuous model is Q(t)=Q0ekt; k>0 means growth and k<0 means decay. Keep units consistent and interpret any calculated time in context.
Solving equations analytically and graphically
An analytical method uses algebra to obtain exact or structured solutions. A graphical method interprets solutions as zeros or intersections and may produce numerical approximations. Neither method is universally superior. Choose the one suited to the function and the command term.
- To solve f(x)=0 graphically, find x-intercepts of y=f(x).
- To solve f(x)=g(x), graph both sides and find intersections, or graph y=f(x)−g(x) and find its zeros.
- For a polynomial that factors, an analytical solution is usually faster and exact.
- For a mixed equation such as ex=sin x, technology may be the appropriate method on a stated interval.
- For a model, reject solutions outside the contextual domain even when they satisfy the algebra.
Worked example: graphical solution with interpretation
Suppose a model requires solutions of x4+5x−6=0. Graph y=x4+5x−6 on a window justified by test values, then use the zero tool to refine each intercept. Record all displayed roots to the requested accuracy and check that no additional branch is hidden. If the context restricts x≥0, report only the non-negative solution and explain the restriction.
When a question asks for a specified number of significant figures or decimal places, retain guard digits until the final line. A graphing calculator’s long decimal is not automatically the correct presentation; match the requested accuracy and include units if appropriate.
Transformations of graphs
Transformations let you sketch a new graph from a known one without creating a table of values from scratch. Changes outside f affect outputs and behave as written. Changes inside f affect inputs and act in the opposite horizontal direction.
| Equation | Transformation of y=f(x) | Point mapping |
|---|---|---|
| y=f(x)+b | Translate vertically by b | (x,y) ↦ (x,y+b) |
| y=f(x−a) | Translate horizontally by a to the right | (x,y) ↦ (x+a,y) |
| y=−f(x) | Reflect in the x-axis | (x,y) ↦ (x,−y) |
| y=f(−x) | Reflect in the y-axis | (x,y) ↦ (−x,y) |
| y=pf(x) | Vertical stretch by scale factor |p|; reflect in x-axis if p<0 | (x,y) ↦ (x,py) |
| y=f(qx) | Horizontal stretch by scale factor 1/|q|; reflect in y-axis if q<0 | (x,y) ↦ (x/q,y) |
Order matters in a composite transformation. Read a target equation carefully and track important points. For example, starting from y=x², the graph y=3(x−2)²+5 has a horizontal shift two units right, a vertical stretch by factor three and a vertical shift five units up. Its vertex is (2,5), which provides a quick sign check.
Technology and graphing-calculator workflow
Technology is an expected part of the course. Good use of a GDC or graphing package is visible in the reasoning: you enter the correct functions, choose a meaningful window, identify the required feature and report a mathematical result rather than a screenshot.
- Prepare algebraically. Record domain restrictions, obvious intercepts and likely asymptotes.
- Enter with brackets. Check fractions, exponents and negative signs against the original expression.
- Choose the window. Use predicted features and the interval specified in the question.
- Select the correct tool. Zero, intersection, maximum, minimum and table functions answer different questions.
- Refine and verify. Zoom or use numeric tools, then substitute or compare with the sketch.
- Communicate. State the equation, value, interval, accuracy and contextual meaning.
Technology can also support investigation. Sliders show how parameters change a graph: varying a in a(x−h)²+k reveals opening and vertical scale; varying h and k reveals translation. The investigation becomes mathematics when you describe a consistent relationship and explain why the formula produces it.
Modelling with functions
A model is a purposeful simplification. Decide what the input and output represent, give units, define a reasonable domain and interpret parameters. A linear model assumes constant additive change; a quadratic model can describe a turning trajectory; an exponential model assumes constant multiplicative change. The most complicated model is not automatically the best one.
After solving, return to the context. A negative time, fractional person or value outside the observed data range may be mathematically valid for the formula but invalid for the problem. Extrapolation is especially risky: a locally useful trend may become unrealistic far outside the data interval. State limitations instead of treating a graphing regression as unquestionable truth.
Worked example: select and interpret a model
A population starts at 2,400 and grows by 6% per year. A discrete annual model is P(t)=2400(1.06)t. Solving P(t)=4000 gives t=ln(4000/2400)/ln(1.06), approximately 8.77. If measurements are continuous, the model reaches 4,000 after about 8.77 years; if the question asks for the first whole annual observation above 4,000, check integer years and report year 9.
Connecting equations, graphs, tables and contexts
Strong Functions answers move fluently between representations. The equation provides exact structure, the graph shows global behavior, a table supplies selected numerical evidence and the context decides which inputs and outputs make sense. Treating these as four views of the same function is more reliable than memorizing a separate procedure for every question.
Suppose a graph has x-intercepts at −1 and 4 and passes through (0,−8). A quadratic with those roots has the form f(x)=a(x+1)(x−4). Substituting the y-intercept gives −8=−4a, so a=2. The equation is f(x)=2(x+1)(x−4). The graph therefore opens upward; its axis lies halfway between the roots at x=3/2. This example shows how a few graphical features can determine an algebraic model.
Now work in the other direction. For g(x)=3−2x, the equation shows a reflection of 2x in the x-axis followed by a translation three units upward. The horizontal asymptote is y=3, the y-intercept is 2 and the function decreases. Its x-intercept satisfies 2x=3, giving x=ln 3/ln 2. Those exact features should be predicted before technology is used.
How parameter questions combine several ideas
A parameter changes an entire family of functions. The question may ask which values create an intersection, a repeated root or a specified range. Translate the requested graph behavior into an algebraic condition. “Touches the x-axis” means a quadratic has one repeated real root, so its discriminant is zero. “Never meets the line” means the equation formed by equating the functions has no real solution, so the relevant discriminant is negative. “Has a minimum of 5” points toward vertex form or completing the square.
Worked example: tangent condition from a discriminant
Find k if the line y=kx+1 is tangent to the parabola y=x²−3x+5. Equating gives x²−(3+k)x+4=0. Tangency means one repeated intersection, so Δ=(3+k)²−16=0. Hence 3+k=±4 and k=1 or −7. Both values should be retained: two different lines through (0,1) are tangent to the parabola.
Build exact reasoning before using decimals
Exact values reveal relationships that early rounding hides. If a quadratic root is 2+√3, its paired root may be 2−√3; replacing both with decimals makes their sum, product and symmetry less obvious. If a logarithmic solution is ln 7/ln 1.04, the exact expression shows the growth factor and target ratio. Convert to a decimal only when the question requests it or when interpreting a measurement.
Exact work also creates useful checks. For x=3±√5, the average of the roots is 3, so the axis of symmetry should be x=3. For a transformation f(x−a)+b, a known point (u,v) should map to (u+a,v+b). For inverse functions, the coordinates of each original point should swap. These small structural checks catch sign errors before they spread through a long solution.
A complete function-analysis template
When a question asks you to “analyse” or “sketch” a function without prescribing every step, use a consistent template. State the domain; find intercepts; determine symmetry when relevant; locate vertices or turning information available from the course; find vertical and horizontal asymptotes; describe end behavior; then add contextual restrictions. You may not need every item for every family, but the checklist prevents important features from being omitted.
Worked example: analyze a transformed reciprocal
Consider h(x)=4+3/(x−2). The domain is x≠2 and the vertical asymptote is x=2. The horizontal asymptote is y=4. Setting h(x)=0 gives 3/(x−2)=−4, so x=5/4; the x-intercept is (5/4,0). The y-intercept is h(0)=5/2. Since the reciprocal coefficient is positive, one branch lies above-right of the center (2,4) and the other below-left. These features are sufficient for an accurate labelled sketch.
How Functions connects to later course topics
Functions is not isolated from the rest of AA. Sequences generate discrete functions; trigonometric equations are solved as intersections or zeros; probability distributions use functional rules; and calculus describes rates of change and accumulated output. A quadratic vertex can later be confirmed by differentiation. Exponential models connect naturally to differential equations and growth rates. Domain awareness becomes essential when differentiating, integrating or composing more complicated expressions.
This is why mixed practice matters. A question may begin with a geometric model, ask you to construct a function, use technology to locate an intersection and finish by interpreting a maximum. Naming the topic too narrowly can hide the connection. Instead, ask what the function represents, which representation is most useful and what the final value means.
Functions exam strategy for AA SL and AA HL
- Read the command term. “Find,” “show,” “sketch,” “solve” and “interpret” require different evidence.
- State restrictions. Record forbidden inputs before cancellation, inversion or logarithmic work.
- Choose the revealing form. Use root form for zeros, vertex form for a turning point and division or rewrite for asymptotes.
- Preserve exact values. Keep fractions, radicals and logarithms exact until a decimal is requested.
- Label graph features. Include axes, intercepts, vertices, asymptotes and relevant coordinates.
- Check all solutions. Reject values outside a mathematical or contextual domain.
- Use technology transparently. Name the graphs or equation and report the requested accuracy.
- Answer the actual question. Finish with an interval, coordinate, parameter value or contextual statement.
Common mistakes and repairs
| Mistake | Why it fails | Repair |
|---|---|---|
| Treating f(x) as multiplication | It is function notation | Read it as “the output of f at x” |
| Giving a formula without domain | The rule may be undefined or context-limited | Check denominators, roots, logarithms and the context |
| Assuming f−1=1/f | Inverse and reciprocal are different operations | Use composition with the identity as a check |
| Applying f before g in f∘g | Composition acts from the inside outward | Write f(g(x)) before substituting |
| Using the same sign for horizontal shifts | Input transformations act oppositely | Track a key input or vertex |
| Forgetting a rational exclusion | A denominator zero is never restored | State the original domain before simplifying |
| Reporting only intersections for an inequality | The solution is usually an interval | Test regions between all boundaries |
| Trusting the default graph window | Features may be hidden or distorted | Predict features and choose a justified window |
| Rounding midway | It can change the final required accuracy | Keep guard digits and round once |
Mixed worked problems
Problem 1: line and quadratic intersection
Find the intersections of y=x²−4x+1 and y=2x−3. Equate outputs: x²−4x+1=2x−3, so x²−6x+4=0. Hence x=3±√5. Substitute into y=2x−3 to get y=3±2√5, using matching signs. The intersections are (3+√5,3+2√5) and (3−√5,3−2√5).
Problem 2: parameter and discriminant
The equation x²−2kx+k+3=0 has two distinct real roots when Δ>0. Here Δ=(−2k)²−4(1)(k+3)=4(k²−k−3). Therefore k²−k−3>0. Its boundary values are [1±√13]/2. Because the quadratic in k opens upward, two distinct real roots occur for k<(1−√13)/2 or k>(1+√13)/2.
Problem 3: inverse and composition check
Let f(x)=(3x−4)/2. Solve y=(3x−4)/2 for x: 2y=3x−4, so x=(2y+4)/3. Thus f−1(x)=(2x+4)/3. Check: f(f−1(x))=[3(2x+4)/3−4]/2=x.
Problem 4: transformation and range
Starting from f(x)=√x, consider g(x)=−2√(x−3)+5. The input requires x≥3. The graph shifts three right, stretches vertically by factor two, reflects in the x-axis and shifts five up. Its endpoint is (3,5), and all later outputs are at most 5. Therefore the range is (−∞,5].
A practical 14-day revision plan
| Days | Focus | Evidence of mastery |
|---|---|---|
| 1-2 | Function notation, domain, range and graph reading | Explain restrictions and label a complete sketch |
| 3 | Straight lines | Move between three forms and solve perpendicular-line questions |
| 4-5 | Composite and inverse functions | State composition domains and verify an inverse |
| 6-7 | Quadratic forms and roots | Choose form strategically and use the discriminant |
| 8 | Reciprocal and rational functions | Sketch from asymptotes and intercepts |
| 9-10 | Exponentials and logarithms | Solve exact equations and interpret a growth model |
| 11 | Transformations | Map key points through composite changes |
| 12 | GDC solving and graph features | Choose windows and report numerical answers correctly |
| 13 | Mixed timed questions | Complete a set without topic labels |
| 14 | Error review | Redo every error and write a one-line prevention rule |
Common questions
Is this page for both IB Math AA SL and HL?
Yes. It covers the current SL 2.1-2.11 Functions content studied by both levels. HL students then add AHL 2.12-2.16.
What Functions topics are HL-only?
The current AHL extension includes polynomial roots and theorems, more advanced rational functions, additional function classifications and inverses, inequalities, and modulus or reciprocal transformations. Use the linked HL-only guide for the full boundary.
Does f inverse mean one divided by f?
No. f−1 reverses a one-to-one function. The reciprocal is 1/f(x). Composition with the original function should produce the identity.
How do I find the range of a function?
Use the graph, a known family, a vertex or endpoint, and any domain restriction. Then ask which output values are actually attained, including whether endpoints belong to the set.
When should I use the quadratic formula?
Use it when factorization is not convenient or when exact roots are required. Completing the square is often better for the vertex, while factorized form is best for known roots and sign analysis.
Can an asymptote cross a graph?
A horizontal asymptote describes end behavior and can sometimes be crossed. A vertical asymptote is an excluded x-value approached by an unbounded branch; the function is not defined on that line.
Should equations be solved graphically or analytically?
Follow the command and choose an appropriate method. Use algebra for exact accessible equations and technology for equations without a suitable analytic approach. Explain the numerical result.
What is the natural domain?
It is the largest real domain on which the formula is defined, unless the question states another domain. Check denominators, even roots and logarithms.
Why do horizontal transformations use the opposite sign?
The new graph reaches an old output when its inside expression equals the old input. Solving x−a=u gives x=u+a, so f(x−a) shifts right by a.
How accurate should a graphing-calculator answer be?
Use the number of significant figures or decimal places requested. If none is stated, follow the course and teacher convention, keep guard digits and include appropriate units.
Is a calculator screenshot enough working?
Usually not. State what was graphed or solved, show the relevant mathematical setup and report the zero, intersection, maximum, minimum or interval in the requested form.
Will the Functions course change for 2029 examinations?
The IB has announced an updated AA course for first teaching in August 2027 and first assessment in May 2029. The published overview says the update refines the course with limited reductions and no added content. Follow your school’s guide for your examination session.
Continue your IB Math AA revision
- Functions formulae for AA HL only
- Number and algebra formulae for AA SL and HL
- Prior learning formulae for AA SL and HL
- Geometry and trigonometry formulae for AA SL and HL
- Calculus formulae for AA SL and HL
Official references: IB Mathematics: Analysis and Approaches guide; IB Diploma Programme mathematics overview; IB Mathematics AA curriculum update.
RevisionTown is an independent educational resource and is not affiliated with or endorsed by the International Baccalaureate Organization. Always use the subject guide and instructions supplied for your examination session.