
Based on the most recent admissions data from the Class of 2029 and Class of 2028 cycles, gaining admission to America’s most selective colleges has become increasingly competitive. The California Institute of Technology (Caltech) currently holds the distinction of being the most selective institution in the United States with a historic acceptance rate of just 2.3%, followed closely by Harvard University at 3.36% and Stanford University at 3.9%. This comprehensive guide examines the landscape of highly selective college admissions using official data from institutional reports, Common Data Sets, and government education statistics.
Understanding the Most Selective Colleges
Top 10 Hardest Colleges to Get Into
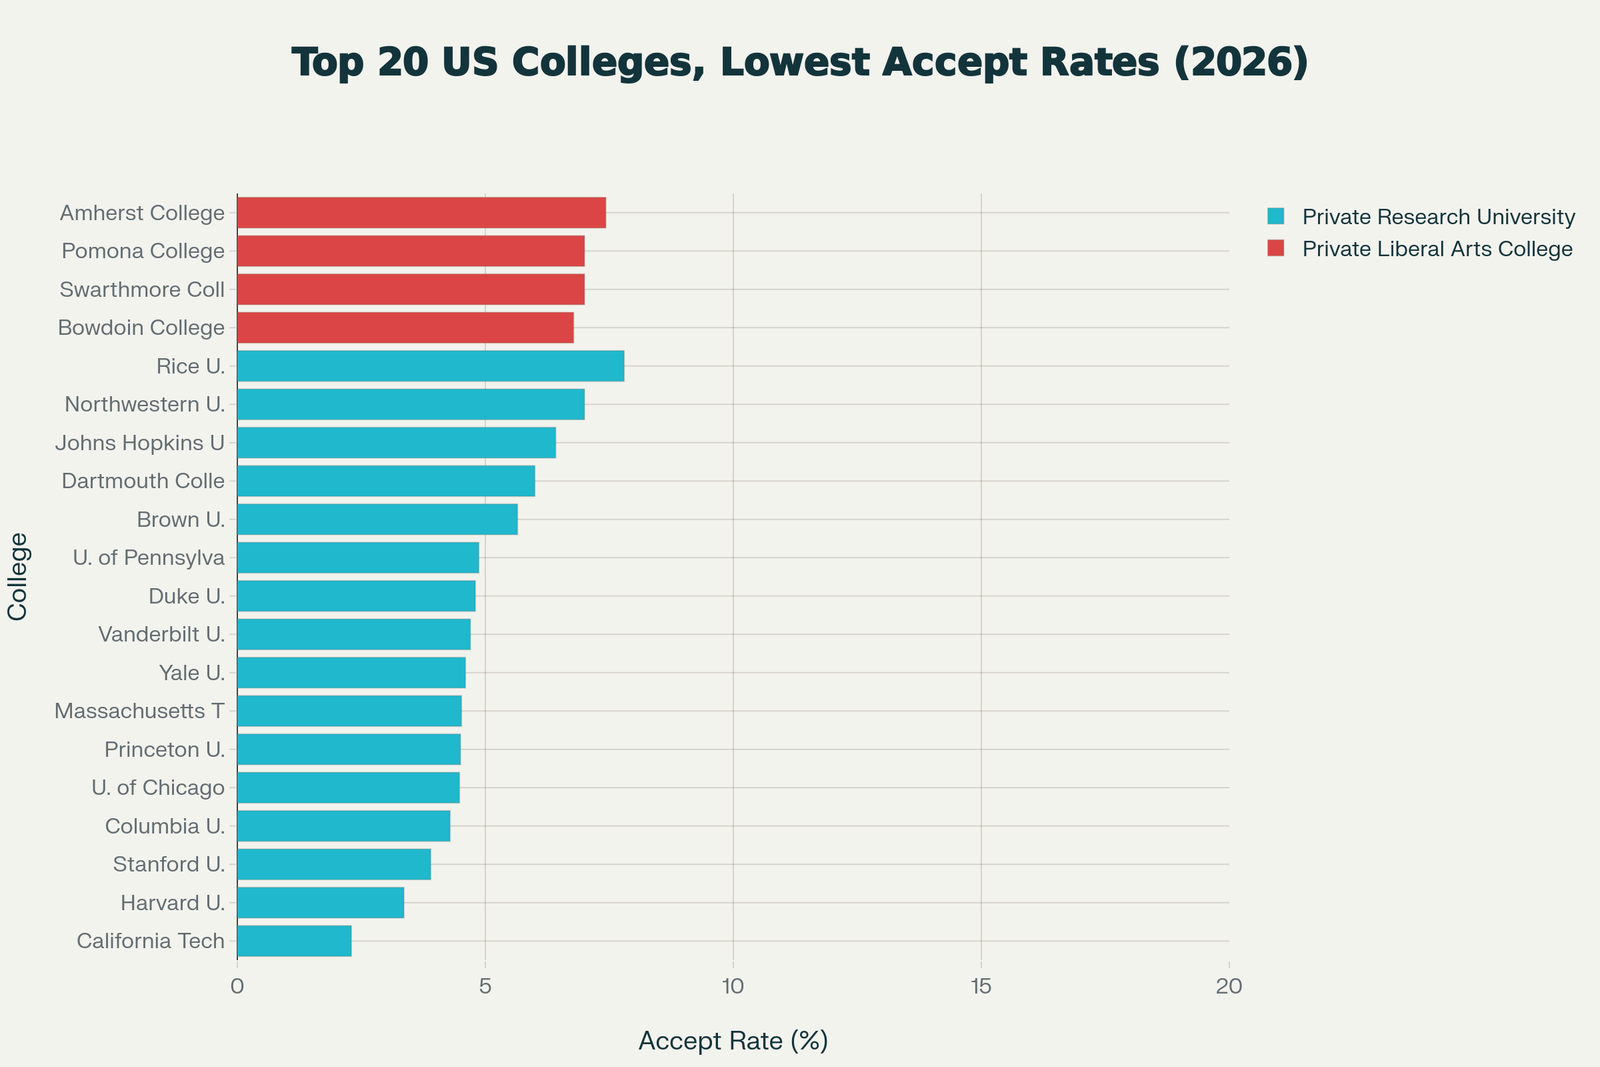
The most exclusive institutions in America demonstrate acceptance rates below 5%, representing an unprecedented level of selectivity. For the Class of 2028 and Class of 2029 admissions cycles, the following institutions ranked as the most difficult to gain admission:
California Institute of Technology (Caltech) leads with a 2.3% acceptance rate, admitting only 315 students from 13,863 applicants for the Class of 2028. This represents a decrease from the previous year’s 3.1% rate, making Caltech the single most selective institution in the nation. The school maintains an equally stringent acceptance rate for both Early Action and Regular Decision applicants, with both pathways showing rates under 5%.
Harvard University follows with an estimated 3.36% acceptance rate for the Class of 2029, accepting approximately 2,003 students from 47,893 applicants. Harvard’s Single Choice Early Action (SCEA) round showed an 8.74% acceptance rate compared to just 2.70% for Regular Decision applicants. The university received 54,008 total applications for the Class of 2028, demonstrating sustained high demand.
Stanford University maintains its position among the most selective with approximately 3.9% acceptance rate, though official Class of 2029 data has not yet been released. For the Class of 2028, Stanford admitted 2,067 students from 57,326 applications, yielding a 3.61% acceptance rate—the lowest in the university’s history at that time.
Columbia University admitted 4.29% of applicants to its Class of 2029, the highest rate in five years but still extraordinarily selective. Out of 59,616 total applications across Early Decision and Regular Decision rounds, Columbia offered admission to 2,556 students.
Massachusetts Institute of Technology (MIT) reported a 4.52% overall acceptance rate for the Class of 2029, admitting 1,324 students from 29,282 applicants. MIT’s Early Action round showed a 5.98% acceptance rate, while Regular Decision maintained approximately 4.72%.
Yale University admitted 4.60% of applicants for the Class of 2029, with 2,308 students offered admission from 50,228 total applications. Yale’s early round acceptance rate stood at 10.82%, significantly higher than the 3.63% Regular Decision rate.
Princeton University is estimated to have approximately a 4.50% acceptance rate for the Class of 2029, though the university has not released complete data. Princeton utilizes Single Choice Early Action, which typically yields higher acceptance rates than the Regular Decision round.
Duke University set a record low acceptance rate of 4.80% for the Class of 2029, admitting 1,953 students from 58,698 applications. This represents Duke’s most selective admissions cycle in its history.
University of Pennsylvania showed a 4.87% acceptance rate, with the school continuing its highly competitive admissions standards. Penn offers binding Early Decision, which provides an advantage to committed applicants.
Vanderbilt University rounded out the top 10 with a 4.70% overall acceptance rate for the Class of 2029, comprising a 13.2% Early Decision rate and just 3.3% Regular Decision rate. Vanderbilt received over 48,000 applications, the largest pool in its history.
Ivy League Acceptance Rates Analysis
All eight Ivy League institutions maintain acceptance rates below 9%, solidifying their position among America’s educational elite. The Ivy League schools demonstrated the following acceptance rates for recent admissions cycles:
Harvard University (3.36%) remains the most selective Ivy League institution. For the Class of 2028, Harvard received 54,008 applications and admitted only 1,937 students, yielding a 3.59% acceptance rate. The university’s yield rate—the percentage of admitted students who choose to enroll—exceeds 80%, indicating strong commitment from accepted applicants.
Princeton University (4.50% estimated) utilizes Single Choice Early Action rather than binding Early Decision, allowing admitted students flexibility while still benefiting from early application advantages. Princeton admitted 1,408 students to the Class of 2029, falling slightly short of its target of 1,425 students.
Yale University (4.60%) saw 2,308 admissions offers extended to the Class of 2029 from over 50,000 applicants. Yale’s SCEA round acceptance rate of 10.82% significantly exceeds its Regular Decision rate of 3.63%.
Columbia University (4.29%) experienced a slight increase in its acceptance rate compared to recent years, though it remains highly selective. Columbia’s location in New York City and Core Curriculum attract intellectually curious students from around the world.
University of Pennsylvania (4.87%) continues its tradition of highly selective admissions. Penn’s Wharton School of Business, School of Engineering and Applied Science, School of Nursing, and College of Arts and Sciences each maintain distinct admissions standards, with some schools more selective than the overall university average.
Brown University (5.65%) admitted 2,418 students from 42,765 applicants for the Class of 2029. Brown’s open curriculum and collaborative academic environment appeal to self-directed learners. The Early Decision acceptance rate of 17.95% far exceeds the 4.01% Regular Decision rate.
Dartmouth College (6.00%) showed a 5.32% acceptance rate for the Class of 2028, admitting 1,685 students from 31,657 applications. Dartmouth experienced an 11% decrease in total applications for the Class of 2029 compared to the previous year.
Cornell University (8.41%) maintains the highest acceptance rate among Ivy League schools but remains highly competitive. As the largest Ivy by undergraduate enrollment, Cornell admits more students than its peers while maintaining rigorous academic standards. Cornell offers seven undergraduate colleges, each with specific admissions criteria.
Liberal Arts Colleges with Lowest Acceptance Rates
The nation’s elite liberal arts colleges provide exceptional undergraduate-focused education with acceptance rates rivaling major research universities. These institutions emphasize close faculty-student relationships, small class sizes, and broad-based liberal arts curricula.
Swarthmore College (7%) ranks among the most selective liberal arts colleges, offering rigorous academics in a collaborative environment near Philadelphia. Students at Swarthmore benefit from the Tri-College Consortium with Bryn Mawr and Haverford Colleges.
Pomona College (7%) leads the Claremont Colleges consortium in Southern California, providing liberal arts education with access to resources from neighboring institutions. Pomona’s acceptance rate has declined significantly in recent years as applications have increased.
Bowdoin College (6.78%) in Brunswick, Maine, maintains test-optional admissions while achieving exceptional selectivity. Bowdoin’s coastal location and strong academic programs in sciences and humanities attract top students nationwide.
Amherst College (7.43%) admitted 1,175 students from a record-high 15,818 applications for the Class of 2029. Amherst participates in the Five College Consortium with Smith, Mount Holyoke, Hampshire, and the University of Massachusetts Amherst.
Williams College (8.50%) received 14,261 applications for the Class of 2029, admitting 1,313 students. Located in the Berkshire Mountains of Massachusetts, Williams excels in tutorial-style learning and undergraduate research opportunities.
Claremont McKenna College (10%) specializes in economics, government, and public affairs within the Claremont Colleges system. CMC’s practical approach to liberal arts education emphasizes leadership development and real-world applications.
Barnard College (9%) serves as Columbia University’s coordinate women’s college in New York City. Barnard students access Columbia’s resources while maintaining their own distinct campus community and curriculum.
The liberal arts colleges demonstrate that small institutions can be equally or more selective than large research universities. Early Decision acceptance rates at these schools can reach 27-31%, significantly higher than Regular Decision rates. For example, Williams College’s Early Decision acceptance rate for the Class of 2027 reached 27%, compared to much lower Regular Decision acceptance.
Service Academies and Specialized Institutions
Federal service academies provide tuition-free education in exchange for military service commitments, maintaining highly competitive admissions.
United States Naval Academy (9%) in Annapolis, Maryland requires congressional nomination alongside academic excellence and physical fitness. The Naval Academy’s median SAT range is 1250-1510, with candidates demonstrating leadership potential and dedication to service.
United States Military Academy at West Point (14%) shows acceptance rates around 10-14% depending on the measurement methodology. Approximately 11,430 students start application files, but only 1,788 become fully qualified (meeting academic, physical, and nomination requirements), and 1,255 ultimately receive appointments. This yields a 70% acceptance rate among fully qualified candidates, though the commonly reported rate includes all who begin the application process.
United States Air Force Academy (approximately 12-17%) maintains similar selectivity to the other service academies with median SAT scores of 1400-1510. The Air Force Academy emphasizes STEM education, aviation, and space studies.
The service academies require additional application components beyond standard college applications, including congressional nominations, Candidate Fitness Assessment, medical examinations, and demonstrated leadership experience. Most successful applicants serve as varsity athletes with team captain experience and maintain strong academic records.
Top Research Universities Beyond the Ivy League
Several elite research universities rival or exceed Ivy League selectivity.
University of Chicago (4.48% for Class of 2028) attracted 43,612 applications, its highest applicant pool ever, and admitted just 1,955 students. UChicago’s intellectually rigorous Core Curriculum and vibrant academic culture appeal to students passionate about learning for its own sake.
Northwestern University (7.00%) admitted approximately 3,170 students from over 53,000 applications for the Class of 2029. Northwestern’s combination of professional schools and liberal arts programs, along with its Chicago-area location, makes it highly desirable.
Johns Hopkins University (6.42% for Class of 2028) extended admission offers to 2,946 students from 45,860 applicants. For the Class of 2029 Regular Decision cycle, Johns Hopkins showed just over 4% acceptance, with 1,732 admitted from 41,549 applicants.
Rice University (7.80%) in Houston, Texas, admitted 2,852 students from 36,777 applications for the Class of 2029. Rice’s residential college system, moderate size, and strong STEM programs create an intimate learning environment within a top research university.
Washington University in St. Louis (14% for Class of 2028) maintains highly selective admissions despite a higher acceptance rate than some peers. WashU is known for its strong pre-professional programs, beautiful campus, and generous merit scholarships for top applicants.
Tufts University (10.5%) admitted 3,507 students from 33,400 applications. Tufts’ global focus, active citizenship emphasis, and proximity to Boston make it attractive to socially conscious students.
University of Southern California (10.4%) admitted 8,700 students from 83,500 applications for the Class of 2029. Despite budget challenges, USC increased its acceptance rate slightly to meet enrollment goals while maintaining high academic standards.
Georgetown University (12%) admitted approximately 3,200 students from 26,800 applications. Georgetown’s location in Washington, D.C., and strength in international relations, government, and business attract politically engaged students. The university will begin accepting the Common Application for Fall 2026 applicants.
University of Notre Dame (9%) admitted students from a record 35,401 applicants utilizing its Restrictive Early Action and Regular Decision paths. Notre Dame’s Catholic identity, strong alumni network, and excellent academics contribute to its selectivity.
Emory University (14.95%) admitted 5,658 students total for the Class of 2029, including those accepted through Early Decision I, Early Decision II, and Regular Decision. Emory’s Atlanta location, strong pre-medical programs, and Oxford College pathway offer multiple entry points.
Public University Selectivity
Elite public universities demonstrate that state institutions can achieve selectivity comparable to private schools.
University of California-Berkeley (approximately 16%) maintains the lowest acceptance rate among UC campuses for out-of-state applicants. Berkeley’s engineering, computer science, and business programs attract applications from around the world. In-state California residents benefit from higher acceptance rates due to UC system priorities.
University of California-Los Angeles (UCLA) (18.5%) ranks as one of the most applied-to universities nationally, receiving well over 100,000 applications annually. UCLA’s combination of academic excellence, location, athletics, and entertainment industry connections makes it highly desirable.
University of Michigan-Ann Arbor (approximately 15.6-17.9%) accepts students through Early Action and Regular Decision pathways. Michigan’s prestigious Ross School of Business, College of Engineering, and LSA College maintain distinct selectivity levels.
University of Virginia (15.4-16.8%) shows different acceptance rates for in-state versus out-of-state applicants. As Thomas Jefferson’s university, UVA combines public university resources with Ivy League-caliber academics and traditions.
University of North Carolina at Chapel Hill (approximately 18.4-28.5% depending on residency) prioritizes North Carolina residents but remains competitive for all applicants. UNC’s journalism, business, and public health programs rank among the nation’s best.
University of Florida (19.77%) has increased selectivity significantly in recent years as Florida’s flagship institution. Strong state support and growing national reputation have attracted applications from top students nationwide.
Academic Requirements and Holistic Admissions
Academic Credentials
Admitted students at the most selective colleges demonstrate near-perfect academic credentials. The typical admitted student profile includes:
GPA Requirements: Most admitted students maintain unweighted GPAs of 3.9-4.0, with weighted GPAs often exceeding 4.2 due to Advanced Placement, International Baccalaureate, or honors coursework. Colleges recalculate GPAs according to their own standards and evaluate rigor in the context of each high school’s offerings.
Standardized Test Scores: Competitive SAT scores typically range from 1500-1600 for the most selective institutions (sub-5% acceptance rates), with middle 50% ranges often falling between 1520-1600. For Ivy League schools specifically, the 25th percentile typically starts around 1480-1490, while the 75th percentile reaches 1550-1580.
ACT score expectations mirror SAT requirements, with competitive scores of 34-36 for the most selective schools and 33-35 for highly selective institutions. Students scoring 35-36 on the ACT place themselves in strong position for consideration.
Test-Optional Policies: Several highly selective schools including Harvard and Princeton have extended test-optional policies through at least 2026. However, Dartmouth College, Yale University, and Brown University have reinstated testing requirements for students entering fall 2025 and beyond. MIT maintained testing requirements throughout the pandemic. Even at test-optional institutions, submitting strong scores can strengthen applications significantly.
Course Rigor: Selective colleges expect students to take the most challenging courses available at their high schools, including AP, IB, or honors classes. Students should aim for 4-5 ratings on AP examinations, particularly in subjects related to their intended majors. Colleges examine course selection patterns to assess whether students challenged themselves appropriately.
Class Rank: While fewer high schools report class rank, admitted students typically place in the top 5-10% of their graduating classes. At the most selective institutions, 90-95% of admitted students ranked in the top 10% of their high school classes.
Holistic Review Process
The most selective colleges employ comprehensive holistic admissions review, examining multiple dimensions of each applicant beyond grades and test scores.
Academic Excellence and Intellectual Curiosity: Admissions officers seek students who demonstrate genuine passion for learning, not merely grade accumulation. Essays, recommendations, and course selection patterns reveal intellectual vitality. Students who pursue independent research, advanced coursework beyond graduation requirements, or self-directed learning projects stand out.
Extracurricular Activities and Leadership: Quality and depth matter more than quantity in extracurricular involvement. Admissions officers prefer students showing sustained commitment (typically 2-4 years) to a few activities rather than superficial participation in many clubs.
Particularly impressive extracurriculars include:
National or international recognition in competitions (Intel Science Fair, Math Olympiad, Debate Championships)
Significant community impact through service or activism
Entrepreneurial ventures or creative projects
Leadership positions with demonstrated influence (student body president, team captain, club founder)
Exceptional artistic or athletic achievement
Meaningful employment or family responsibilities managed alongside academics
The most competitive applicants often demonstrate “spike” profiles—exceptional depth and achievement in one or two areas—rather than well-rounded participation across many activities. Admissions officers appreciate students who pursued genuine interests authentically rather than resume-building.
Personal Qualities and Character: Essays, recommendation letters, and interviews reveal applicants’ personal attributes. Colleges value resilience, empathy, integrity, collaboration skills, and the ability to learn from failure. Students who overcame significant obstacles or demonstrated growth through challenges often stand out.
Contextual Factors: Holistic review considers each student within their specific circumstances. Admissions officers evaluate:
High school quality and resources available
Geographic location (rural, urban, suburban)
Socioeconomic status and family circumstances
First-generation college student status
Family and work responsibilities
Educational and cultural background
Students who excelled despite limited opportunities or significant obstacles may be viewed more favorably than those with every advantage. This context-sensitive approach promotes diversity and equity in admissions.
Institutional Priorities: Each college maintains specific institutional goals that influence admissions decisions. These priorities might include:
Geographic diversity (recruiting students from underrepresented states or countries)
Intended major balance (ensuring sufficient students across all departments)
Demographic diversity (including racial, ethnic, socioeconomic, and gender diversity)
Special talents (recruiting musicians, artists, athletes, or other specialists)
Legacy connections and development considerations
Understanding that admissions decisions balance institutional needs with individual merit helps applicants maintain perspective during the competitive process.
Application Strategies and Timeline
Early Decision vs. Early Action vs. Regular Decision
Application timing significantly impacts admission odds at selective colleges.
Early Decision (ED) represents a binding commitment to enroll if admitted. Students may apply to only one school through Early Decision and must withdraw all other applications upon acceptance. ED deadlines typically fall on November 1 or November 15, with decisions released in mid-December.
Early Decision offers substantial admission advantages at many selective schools. For example:
Brown University: 17.95% ED acceptance vs. 4.01% RD acceptance
Dartmouth College: 17.07% ED vs. 3.84% RD
Vanderbilt University: 13.2% ED vs. 3.3% RD
Northwestern University: Significantly higher ED acceptance than overall 7% rate
Many liberal arts colleges show even more dramatic differences, with Williams College’s ED rate reaching 27-31% compared to much lower RD rates. However, ED should only be used when students are certain about their top choice, as the binding commitment requires enrollment regardless of financial aid offers (though students can be released if aid is insufficient).
Early Action (EA) allows early application without binding commitment. Students receive decisions in mid-December but can compare offers before committing by May 1. Some schools offer Restrictive Early Action (REA) or Single Choice Early Action (SCEA), which prohibits applying early to other private institutions while allowing early applications to public universities.
Harvard, Princeton, Yale, and Stanford utilize SCEA programs. These schools show higher acceptance rates in early rounds (Harvard SCEA: 8.74% vs. RD: 2.70%), though the early applicant pools are typically stronger than regular pools.
Regular Decision (RD) represents the standard application timeline with deadlines typically between January 1 and January 15. Admission decisions arrive in late March or early April. Regular Decision allows students maximum time to strengthen applications, improve test scores, and complete additional coursework. Students can apply to unlimited schools through Regular Decision.
Rolling Admissions operates on a first-come, first-served basis with no set deadline. Many public universities use rolling admissions, reviewing applications as they arrive and making decisions within 4-6 weeks. Applying early in the rolling window (September-October) provides the best chances, as spots fill gradually.
Application Deadlines for 2025-2026 Cycle
Key dates for the Class of 2030 (students applying in fall 2025 for fall 2026 enrollment):
Early Decision/Early Action: November 1, 2025 (most schools) or November 15, 2025 (some schools)
Regular Decision: January 1-15, 2026 (most selective private schools)
University of California System: December 1, 2025 (all UC campuses)
CSS Profile/Financial Aid: Priority deadlines often coincide with application deadlines; submit financial aid forms simultaneously with applications
Students should verify specific deadlines with each institution’s admissions office, as dates vary by school.
Financial Aid at Selective Colleges
Need-Blind Admissions Policies
All eight Ivy League institutions practice need-blind admissions for U.S. citizens and permanent residents, meaning financial need does not affect admission decisions. Harvard, Yale, Princeton, and Dartmouth extend need-blind policies to international students as well.
Additional highly selective need-blind schools include:
Massachusetts Institute of Technology
Stanford University (need-blind for all applicants)
University of Chicago
Duke University
Northwestern University
Vanderbilt University
Caltech
Need-blind admission ensures qualified students can gain admission regardless of ability to pay. However, need-blind does not automatically guarantee sufficient financial aid—students must still complete financial aid applications and demonstrate need.
Meeting Full Demonstrated Need
Most highly selective colleges commit to meeting 100% of demonstrated financial need for admitted students. This means that if a family’s expected contribution (calculated via FAFSA and CSS Profile) is $15,000 but the school costs $80,000, the institution provides $65,000 in grants, scholarships, and work-study to bridge the gap.
No-Loan Policies: Several top institutions have eliminated loans from financial aid packages, replacing them with grants and scholarships. These schools include:
Harvard University
Princeton University
Yale University
Stanford University
MIT
Brown University (for families earning under $125,000)
Dartmouth College (for families earning under $125,000)
Under these policies, students graduate debt-free or with minimal debt, as the schools provide grant aid rather than requiring student loans.
Average Aid Packages: At the most generous institutions, average grant amounts often exceed tuition costs. For example:
Princeton’s Class of 2025 received average grants exceeding annual tuition
Harvard families with incomes under $85,000 typically pay nothing
Yale provides full scholarships to students from families earning under $75,000
Students from middle-income families ($100,000-$200,000 annual income) often receive substantial aid as well, though exact amounts depend on family assets, number of children in college, and other factors.
Applying for Financial Aid
Key Forms and Deadlines:
FAFSA (Free Application for Federal Student Aid): Opens October 1; submit as early as possible
CSS Profile: Required by most private selective colleges; opens October 1
Institutional forms: Some schools require additional documentation beyond FAFSA and CSS Profile
Tax documents: Have parent and student tax returns, W-2s, and financial statements ready
Net Price Calculators: Every college website includes a net price calculator providing personalized financial aid estimates. Students should use these tools before applying to ensure affordability, particularly if need is significant.
Application Fee Waivers: Students receiving free or reduced-price lunch, participating in federal assistance programs, or facing financial hardship qualify for application fee waivers. The Common Application provides automatic fee waivers to qualifying students.
Tips for Applying to Highly Selective Colleges
Building a Strong Application
Start Early: Begin preparing freshman year of high school by taking challenging courses, developing meaningful extracurricular commitments, and building relationships with teachers who will write recommendations.
Focus on Depth Over Breadth: Admissions officers prefer sustained commitment to a few activities (2-4 years) over superficial participation in many clubs. Develop expertise and achieve recognition in your chosen areas rather than padding your resume.
Demonstrate Impact: Show how your activities made a difference beyond yourself—in your school, community, or field of interest. Quantify impact when possible (dollars raised, people served, problems solved).
Tell a Coherent Story: Your application components should fit together to present a clear narrative about who you are and what you value. Course selection, activities, essays, and intended major should align logically.
Craft Exceptional Essays: Personal statements provide the best opportunity to distinguish yourself from other high-achieving applicants. Write authentically about meaningful experiences rather than what you think admissions officers want to hear. Show vulnerability, growth, and reflection.
Secure Strong Recommendations: Choose teachers who know you well and can speak to your intellectual curiosity, character, and contributions to the classroom community. Provide recommenders with a resume or activity sheet highlighting your achievements.
Demonstrate Interest: For schools that track demonstrated interest, attend information sessions, tour campus, interview, and engage meaningfully with admissions representatives. Genuine enthusiasm for specific programs and aspects of each school should come through in supplemental essays.
Apply Strategically: Create a balanced college list including reach schools (acceptance rates under 20%), target schools (acceptance rates 20-50% where your credentials match admitted student profiles), and safety schools (acceptance rates over 50% where you exceed typical admitted student credentials).
Managing Expectations
With acceptance rates below 5% at many top schools, even perfectly qualified applicants face rejection. Each highly selective college rejects thousands of students who could succeed academically. Understanding this reality helps students approach admissions with appropriate perspective.
Build a Balanced List: Apply to 10-15 colleges including reaches, targets, and safeties. Love your safety schools—many excellent institutions offer outstanding education with higher acceptance rates.
Consider Alternatives: Liberal arts colleges, honors programs at public universities, and less famous selective schools often provide equivalent education with better admission odds. Research lesser-known gems that match your interests and goals.
Waitlist Strategy: If waitlisted at a top choice, demonstrate continued interest by submitting additional materials, updating the admissions office on new achievements, and reaffirming your commitment to attend if admitted. However, waitlist acceptance rates can be extremely low (often 0-10%), so commit to an admitted school by May 1 while pursuing waitlist opportunities.
International Student Considerations: International applicants face even more competitive odds at most selective U.S. colleges. Only a handful of institutions offer need-blind admission to international students (Harvard, Yale, Princeton, MIT, and Amherst). Research schools with strong international student support and financial aid availability.
Test Requirements: Stay informed about testing requirements, as policies continue to evolve. Several schools reinstated requirements for fall 2025 entry after implementing test-optional policies during COVID-19. Check each school’s specific policy for your application year.
Conclusion
Gaining admission to colleges with the lowest acceptance rates requires exceptional academic credentials, meaningful extracurricular achievements, compelling personal qualities, and often an element of luck. The most selective institutions—led by Caltech (2.3%), Harvard (3.36%), and Stanford (3.9%)—admit fewer than 5% of applicants, representing historic lows in American higher education.
However, selectivity does not equal quality. Hundreds of excellent colleges and universities across the United States provide outstanding education with higher acceptance rates. Students should focus on finding the right fit—academically, socially, financially, and culturally—rather than chasing prestige alone.
For students determined to pursue the most selective institutions, the path forward requires beginning early, challenging yourself academically, developing genuine passions, making meaningful contributions to your communities, and presenting an authentic, compelling application. With proper preparation, strategic planning, and realistic expectations, students can navigate the competitive admissions landscape successfully while maintaining their well-being and sense of self-worth regardless of outcomes.
The data presented in this guide comes from official institutional reports, Common Data Sets, government education statistics, and verified admissions announcements for the Class of 2028 and Class of 2029 admissions cycles. Prospective students should verify current acceptance rates and requirements directly with institutions, as data continues to evolve with each admissions cycle.