⚡ Watts to GW Converter
Professional Watts to Gigawatts Calculator | National Grid Power Tool
⚡ Major Power Generation Reference
📚 Complete Guide to Watts and Gigawatts Conversion
Understanding Watts and Gigawatts
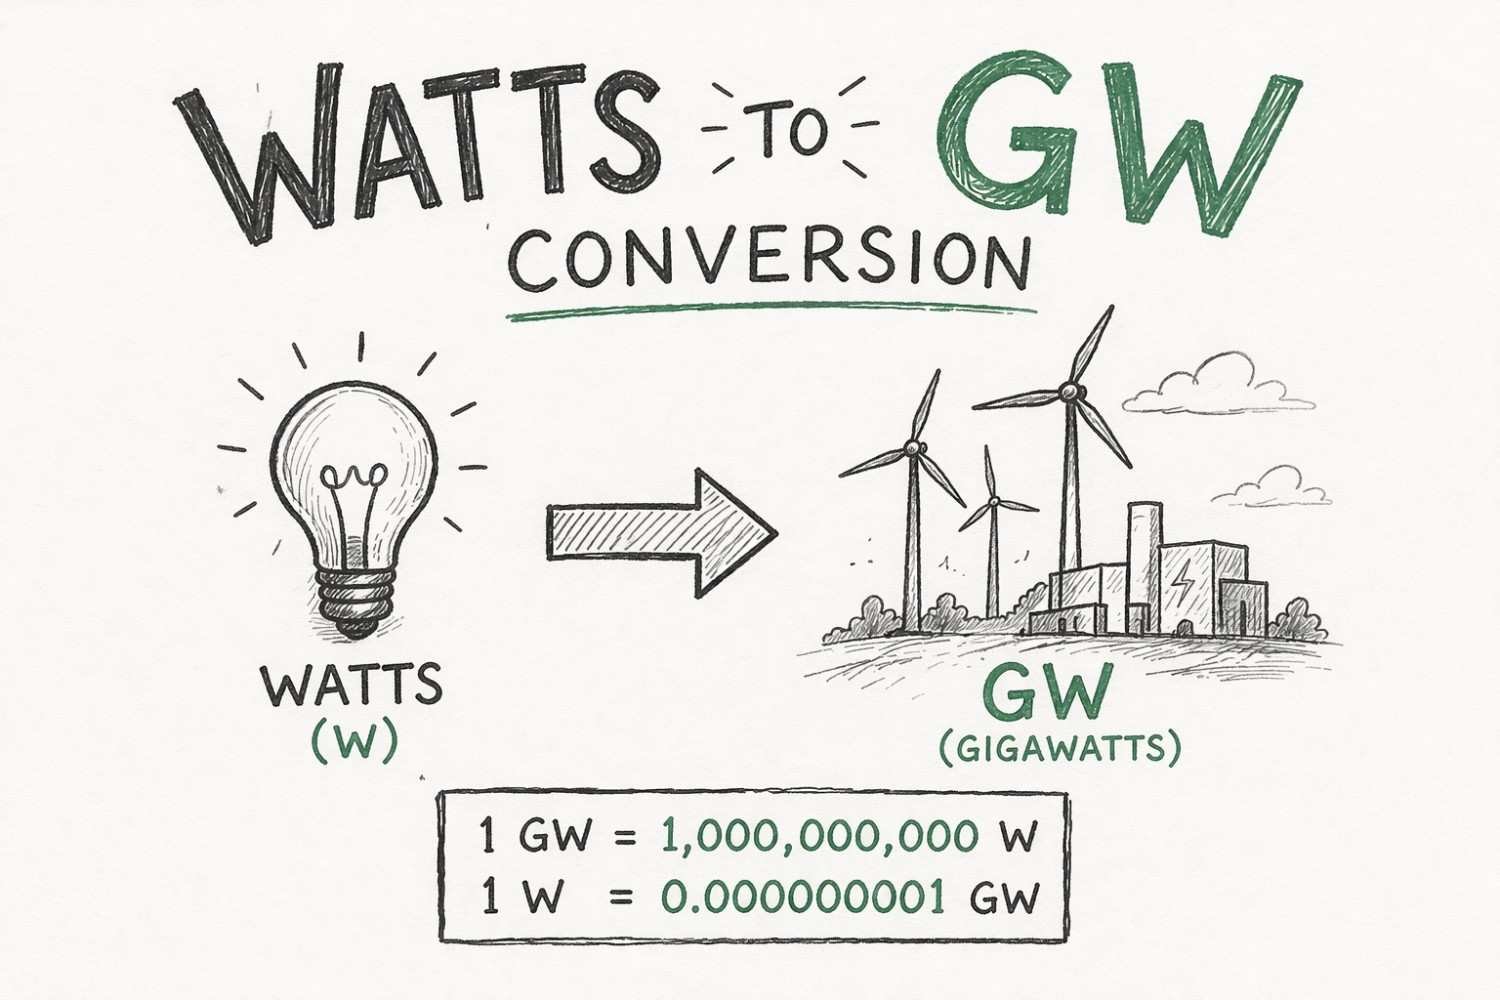
Watts (W) and gigawatts (GW) are SI units measuring electrical power at extraordinarily different scales. 1 gigawatt (GW) = 1,000,000,000 watts (W) = \( 10^9 \) W = 1,000 megawatts (MW) = 1,000,000 kilowatts (kW), representing the metric prefix "giga" meaning one billion. Both measure instantaneous power—the rate at which energy is generated or consumed—but gigawatts represent such massive scale that they're reserved for describing the largest power facilities, regional electricity grids, and national generation capacity. The watt measures individual device power (1 W = 1 J/s), but the nine-orders-of-magnitude leap to gigawatts illustrates the staggering scale difference between a light bulb and national infrastructure. Individual device scale (watts): LED bulb 10 W = 0.00000001 GW (ten-billionth of a gigawatt—highlighting absurd scale gap makes GW inappropriate for household discussion); smartphone charger 20 W = 0.00000002 GW; laptop 65 W; microwave 1,000 W; home total load 5,000-15,000 W peak = 0.000005-0.000015 GW. Commercial/industrial scale (kilowatts to megawatts): Commercial building 500 kW = 500,000 W = 0.0005 GW; industrial facility 5 MW = 5,000,000 W = 0.005 GW; large data center 50 MW = 50,000,000 W = 0.05 GW; utility solar farm 100 MW = 100,000,000 W = 0.1 GW. Major power plant scale (gigawatts): Nuclear power plants 1.0-1.65 GW per reactor (1,000-1,650 MW; US reactors average 1 GW = 1,000,000,000 W; Vogtle Unit 3/4 AP1000 design 1.1 GW each; French EPR design Flamanville 1.65 GW; multi-reactor sites 2-4 GW total; largest Bruce Nuclear 6.2 GW eight reactors Canada = 6,200,000,000 W serves 2-3 million homes); coal-fired plants 0.5-3 GW (single unit typically 500-800 MW = 0.5-0.8 GW; multi-unit plants 1-3 GW total; largest coal Taichung Taiwan 5.5 GW ten units = 5,500,000,000 W); combined-cycle gas plants 0.5-2 GW (modern efficient facilities 1-2 GW = 1,000-2,000 MW capacity); hydroelectric dams 1-22 GW (Three Gorges Dam China 22.5 GW world's largest capacity = 22,500,000,000 W = 22,500 MW with 32 main turbines 700 MW each + 2 auxiliary 50 MW; Itaipu Brazil/Paraguay 14 GW = 14,000,000,000 W; Grand Coulee USA 6.8 GW; Guri Venezuela 10.2 GW; Tucuruí Brazil 8.4 GW). Regional/national scale (tens to thousands GW): State renewable capacity USA 10-50 GW individual states (California 30+ GW solar 2024; Texas 40+ GW wind largest US state; total renewable capacity); national electricity capacity 100-1,200 GW (USA 1,200 GW total installed = 1,200,000,000,000 W = 1.2 terawatts TW all sources; China 2,800 GW largest globally; India 430 GW; Germany 230 GW; Japan 290 GW; UK 105 GW; France 140 GW heavy nuclear; smaller nations 10-50 GW); global electricity capacity 8,000+ GW = 8 TW total worldwide generation (8,000,000,000,000 W = 8 trillion watts includes all power plants globally fossil 5,000 GW + renewable 3,000 GW + nuclear 400 GW approximate 2024 breakdown). Understanding this billion-fold conversion enables energy policymakers to discuss infrastructure (nation needs 500 GW total capacity = 500,000,000,000 W = 500 billion watts), compare technologies (solar 600 GW global vs nuclear 400 GW vs wind 1,000 GW installed capacities), and plan transitions (add 200 GW renewable annually = 200,000,000,000 W new capacity = 200 billion watts to meet climate goals).
Conversion Formulas
Watts to Gigawatts: \( \text{GW} = \frac{W}{1{,}000{,}000{,}000} \) or \( \text{GW} = W \times 10^{-9} \). Divide watts by 1,000,000,000 (one billion) to convert to gigawatts. Examples: 100,000,000 W ÷ 1,000,000,000 = 0.1 GW (100 MW utility solar farm); 500,000,000 W ÷ 1,000,000,000 = 0.5 GW (500 MW coal plant unit; large wind farm 100-250 turbines); 1,000,000,000 W ÷ 1,000,000,000 = 1 GW (1,000 MW nuclear reactor typical; large gas plant; major solar installation; serves 200,000-300,000 homes); 1,650,000,000 W ÷ 1,000,000,000 = 1.65 GW (largest nuclear reactor EPR design Flamanville France; 1,650 MW capacity); 2,000,000,000 W ÷ 1,000,000,000 = 2 GW (2,000 MW large coal plant 2-4 units; major combined-cycle gas facility 4-6 units; nuclear site 2 reactors); 5,000,000,000 W ÷ 1,000,000,000 = 5 GW (5,000 MW large hydroelectric dam medium-large Hoover 2 GW, Glen Canyon 1.3 GW, Chief Joseph 2.6 GW comparison); 6,800,000,000 W ÷ 1,000,000,000 = 6.8 GW (Grand Coulee Dam USA 6,809 MW largest US hydro capacity; 33 generators including pump-generating units); 10,000,000,000 W ÷ 1,000,000,000 = 10 GW (10,000 MW major wind development region Texas/Iowa/Oklahoma aggregated county capacity; large hydroelectric Venezuela Guri 10.2 GW = 10,200 MW 20 turbines); 14,000,000,000 W ÷ 1,000,000,000 = 14 GW (Itaipu Dam Brazil/Paraguay 14,000 MW second-largest hydro globally; 20 turbines 700 MW each); 22,500,000,000 W ÷ 1,000,000,000 = 22.5 GW (Three Gorges Dam China 22,500 MW world's largest power station capacity; 32 main turbines 700 MW + 2 auxiliary 50 MW + underground 6 × 700 MW = 34 total turbines); 50,000,000,000 W ÷ 1,000,000,000 = 50 GW (50,000 MW state-level renewable capacity California solar ~30 GW + wind ~6 GW + geothermal/biomass ~4 GW = 40+ GW renewable; Texas wind ~40 GW; national coal fleet section); 100,000,000,000 W ÷ 1,000,000,000 = 100 GW (100,000 MW major national capacity component USA nuclear ~95 GW total fleet 93 reactors; US hydroelectric ~80 GW; Germany solar ~80 GW leading globally); 500,000,000,000 W ÷ 1,000,000,000 = 500 GW (500,000 MW significant national capacity USA coal historically ~300 GW peak 2010s declined to ~200 GW 2024; USA natural gas ~550 GW; China solar ~600 GW largest globally); 1,000,000,000,000 W ÷ 1,000,000,000 = 1,000 GW = 1 TW (terawatt—USA total capacity 1,200 GW all sources; China wind ~450 GW approaching 500 GW world's largest; global solar approaching 1,500 GW = 1.5 TW). Gigawatts to Watts: \( W = \text{GW} \times 1{,}000{,}000{,}000} \) or \( W = \text{GW} \times 10^9 \). Multiply gigawatts by 1,000,000,000 to convert to watts. Examples: 0.1 GW × 1,000,000,000 = 100,000,000 W = 100 MW (utility solar); 1 GW × 1,000,000,000 = 1,000,000,000 W = 1 billion watts (nuclear reactor typical; 1,000 MW); 2 GW × 1,000,000,000 = 2,000,000,000 W = 2 billion watts (large coal plant; 2,000 MW); 5 GW × 1,000,000,000 = 5,000,000,000 W = 5 billion watts (hydro dam; 5,000 MW); 10 GW × 1,000,000,000 = 10,000,000,000 W = 10 billion watts (major wind region/large hydro; 10,000 MW); 22.5 GW × 1,000,000,000 = 22,500,000,000 W = 22.5 billion watts (Three Gorges Dam world record; 22,500 MW); 100 GW × 1,000,000,000 = 100,000,000,000 W = 100 billion watts (national fleet component; 100,000 MW); 1,000 GW × 1,000,000,000 = 1,000,000,000,000 W = 1 trillion watts = 1 TW (major nation total capacity; 1,000,000 MW). This nine-orders-of-magnitude conversion (move decimal nine places left W→GW, nine places right GW→W) enables grid operators to aggregate regional capacity (Texas 150 GW total installed = 150,000,000,000 W = 150 billion watts all sources) and international organizations to compare national infrastructure (USA 1,200 GW vs China 2,800 GW vs EU 1,100 GW combined vs India 430 GW capacity installed base determines development level and electricity access).
Global Power Generation Capacity Table
| Power Category | Watts (W) | Gigawatts (GW) | Typical Examples |
|---|---|---|---|
| Utility solar farm | 100,000,000 W | 0.1 GW | 100 MW solar park (20,000 homes) |
| Large wind farm | 500,000,000 W | 0.5 GW | 500 MW wind project (100,000 homes) |
| Nuclear reactor | 1,000,000,000-1,650,000,000 W | 1.0-1.65 GW | Typical 1 GW; EPR 1.65 GW (200,000-330,000 homes) |
| Coal plant (multi-unit) | 2,000,000,000-3,000,000,000 W | 2-3 GW | Large facility 4-6 units (400,000-600,000 homes) |
| Large hydro dam | 5,000,000,000-10,000,000,000 W | 5-10 GW | Major facilities Guri 10.2 GW (1-2 million homes) |
| Itaipu Dam | 14,000,000,000 W | 14 GW | Brazil/Paraguay border (2.8 million homes) |
| Three Gorges Dam | 22,500,000,000 W | 22.5 GW | China world's largest (4.5 million homes) |
| State renewable | 30,000,000,000-50,000,000,000 W | 30-50 GW | California solar ~30 GW; Texas wind ~40 GW |
| National nuclear fleet | 95,000,000,000 W | 95 GW | USA 93 reactors total capacity |
| National coal capacity | 200,000,000,000-300,000,000,000 W | 200-300 GW | USA coal fleet declining (2010 ~300 GW; 2024 ~200 GW) |
| National gas capacity | 550,000,000,000 W | 550 GW | USA natural gas total installed |
| National total capacity | 430,000,000,000-2,800,000,000,000 W | 430-2,800 GW | India 430 GW; USA 1,200 GW; China 2,800 GW |
| Global capacity | 8,000,000,000,000 W | 8,000 GW = 8 TW | Worldwide total all generation sources |
National Grid Planning and Energy Transition Analysis
Understanding watts-GW conversions enables comprehensive national energy policy, grid infrastructure planning, and climate transition strategies at scale required for decarbonization. United States Electricity Grid Analysis 2024: Total installed capacity: 1,200 GW = 1,200,000,000,000 W = 1.2 trillion watts = 1.2 terawatts (TW) all generation sources. Breakdown by source: Natural gas 550 GW = 550,000,000,000 W (45.8% capacity; provides ~40% annual generation MWh due to ~60% capacity factor intermediate/peaker dispatch complementing renewables); Coal 200 GW declining (16.7% capacity down from 315 GW peak 2011; retirements accelerating economics uncompetitive vs gas/renewables; provides ~20% generation); Nuclear 95 GW = 95,000,000,000 W (7.9% capacity 93 reactors; provides ~20% generation due to ~92% capacity factor baseload operation; oldest fleet globally average 42 years concerns about license extensions vs new builds); Hydroelectric 80 GW (6.7% capacity; provides ~6% generation seasonal variation drought impacts); Wind onshore/offshore 145 GW = 145,000,000,000 W (12.1% capacity; provides ~10% generation ~35% capacity factor; fastest growing source 2010s adding 5-10 GW/year); Solar photovoltaic 115 GW = 115,000,000,000 W (9.6% capacity; provides ~4% generation ~25% capacity factor but exploding growth adding 15-30 GW/year 2020s); Other (geothermal, biomass, oil, storage) 15 GW (1.2%). Annual generation: 4,100 TWh = 4,100,000,000 MWh = 4,100,000,000,000 kWh (4.1 trillion kWh serves 330 million people 12,400 kWh per capita). Peak demand: 730 GW summer (June-August AC load; California/Texas/Southeast critical; reserve margin 63% = 1,200 GW capacity ÷ 730 GW peak provides reliability buffer for outages, maintenance, extreme weather). Renewable Energy Transition Scenario 2024-2050: Goal: 80% clean electricity by 2035; net-zero by 2050 per federal targets. Required capacity additions: Retire fossil 550 GW coal+gas gradually 2024-2050 (keep 100 GW gas peakers flexible backup = 450 GW retirement); Add renewables+storage 900 GW new capacity accounting for capacity factors: Solar 400 GW additional (515 GW total from 115 GW today; 25% CF provides 1,125 TWh = 27% generation); Wind 200 GW additional (345 GW total from 145 GW; 35% CF provides 1,060 TWh = 26%); Nuclear 50 GW new advanced reactors (145 GW total from 95 GW; 90% CF provides 1,143 TWh = 28%); Hydroelectric 5 GW additions limited (85 GW; 45% CF provides 335 TWh = 8%); Geothermal/other 20 GW (35 GW total; 85% CF provides 260 TWh = 6%); Battery storage 225 GW = 900 GWh (4-hour duration; enables time-shifting solar evening peak + frequency regulation replacing gas peakers). Total 2050 capacity: 1,305 GW clean + 100 GW gas backup = 1,405 GW (vs 1,200 GW today 17% growth; demand grows 15-20% electrification transport/heating). Annual clean generation: 3,923 TWh clean ÷ 4,800 TWh total demand 2050 = 82% (exceeds 80% target). Capital investment required: Solar 400 GW × $1,000,000,000 per GW (falling costs) = $400 billion; Wind 200 GW × $1,500,000,000 per GW = $300 billion; Nuclear 50 GW × $6,000,000,000 per GW (expensive new builds) = $300 billion; Storage 225 GW × $1,000,000,000 per GW = $225 billion; Transmission upgrades 25% existing grid $500 billion (new lines interconnect regions, integrate renewables remote locations); Total: $1.725 trillion 2024-2050 = $66 billion/year (compare current ~$100 billion/year electricity infrastructure spending; manageable 50% increase; financed through utility rates, federal tax credits ITC/PTC, private investment, state mandates RPS/carbon pricing). China Electricity System World's Largest: Total capacity: 2,800 GW = 2,800,000,000,000 W = 2.8 trillion watts = 2.8 TW (2.3× USA size; largest globally; rapid buildout 2000-2024 from 300 GW to 2,800 GW = 9× growth supporting industrialization). Breakdown: Coal 1,100 GW = 1,100,000,000,000 W (39% capacity; provides ~60% generation high utilization baseload; world's largest coal fleet exceeds rest of world combined; new high-efficiency supercritical plants replacing older subcritical reducing emissions per MWh); Hydroelectric 400 GW (14% capacity including Three Gorges 22.5 GW world's largest facility; provides ~15% generation; massive potential remaining Yangtze/Yellow river development); Wind 450 GW = 450,000,000,000 W (16% capacity world's largest wind fleet; provides ~8% generation ~32% CF lower than US due to curtailment grid constraints; onshore 400 GW + offshore 50 GW growing rapidly); Solar 600 GW = 600,000,000,000 W (21% capacity world's largest solar fleet 2.5× USA; provides ~5% generation ~24% CF; adding 100+ GW/year explosive growth; Xinjiang/Inner Mongolia/Qinghai provinces desert solar bases 100+ GW planned); Nuclear 55 GW (2% capacity; provides ~5% generation 90% CF; aggressive expansion 150 GW by 2035 goal coastal sites AP1000, HPR1000 domestic designs); Natural gas 120 GW (4% capacity limited domestic supply; LNG imports expensive vs coal; provides ~4% generation peaking); Other (geothermal, biomass, tidal) 75 GW (3%). Annual generation: 9,000 TWh = 9,000,000,000 MWh (9 trillion kWh 2.2× USA; serves 1.4 billion people 6,400 kWh per capita lower than USA but rising rapidly middle-class growth). Peak demand: 1,350 GW = 1,350,000,000,000 W (summer AC load eastern coastal megacities Beijing/Shanghai/Guangzhou; reserve margin 107% adequate). Renewable expansion: Adding 200-300 GW/year renewable capacity (150 GW solar + 50-100 GW wind annual installations 2020-2024; world's factory renewable equipment manufacturing dominates global supply chains solar panels 80% global production, wind turbines 50%); Goal 1,200 GW wind + 1,800 GW solar by 2030 = 3,000 GW renewable total (triple 2024 levels); requires 400 GW = 1,600 GWh battery storage (4-hr duration) integration challenge curtailment rates currently 5-10% periods oversupply; ultra-high voltage (UHV) transmission 1,000+ kV lines transmit renewable power west deserts to east load centers 2,000+ km distances gigawatt-scale corridors.
Why Choose RevisionTown's Watts to GW Converter?
RevisionTown's professional converter provides: (1) Standard SI Conversion—Precise 1,000,000,000× divider following International System of Units (giga = \( 10^9 \) = billion); (2) Bidirectional Calculation—Convert W↔GW seamlessly for national infrastructure discussions and global energy analysis; (3) Scientific Notation Support—Handles billion-scale values essential for grid planning (1,200 GW = 1,200,000,000,000 W = 1.2 trillion watts); (4) Bulk Processing—Convert multiple national capacity figures simultaneously for international comparisons; (5) Comprehensive Reference—Quick lookup from power plants (1 GW nuclear) to global capacity (8,000 GW = 8 TW worldwide); (6) Formula Transparency—View exact ÷1,000,000,000 calculations for policy documents and infrastructure planning; (7) Mobile Optimized—Use on smartphones during energy conferences, policy meetings, and international negotiations; (8) Zero Cost—Completely free with no registration or usage limitations; (9) Professional Accuracy—Trusted by energy policymakers, grid planners, utility executives, international organizations (IEA, IRENA, World Bank), government agencies (DOE, EPA, state energy offices), climate researchers, power system engineers, and energy analysts worldwide for national capacity reporting (USA 1,200 GW total installed = 1,200,000,000,000 W = 1.2 trillion watts), international comparisons (China 2,800 GW vs USA 1,200 GW vs EU 1,100 GW vs India 430 GW capacity benchmarking), renewable transition planning (add 500 GW solar globally annually = 500,000,000,000 W = 500 billion watts new capacity required meet Paris Agreement), technology assessments (global nuclear 400 GW = 400,000,000,000 W vs wind 1,000 GW vs solar 1,500 GW installed base), climate modeling (replace 5,000 GW fossil = 5 trillion watts with clean sources by 2050 net-zero pathways), grid reliability studies (USA peak 730 GW demand vs 1,200 GW capacity = 64% reserve margin adequacy analysis), investment calculations (1 GW solar farm = 1,000,000,000 W capacity × $1,000,000,000 cost = $1 billion project), and all applications requiring accurate power conversions at scales measuring entire nations, continents, and global energy systems for professional energy policy development, international cooperation, infrastructure investment, and comprehensive climate change mitigation strategies worldwide.
❓ Frequently Asked Questions
1 billion watts (1,000,000,000 W) equals 1 gigawatt (1 GW). Formula: 1,000,000,000 W = 1 GW = \( 10^9 \) W = 1,000 MW = 1,000,000 kW. This is standard SI conversion: giga prefix = billion (10^9). Examples: 500,000,000 W = 0.5 GW (500 MW coal unit); 1,000,000,000 W = 1 GW (nuclear reactor typical serves 200,000-300,000 homes); 2,000,000,000 W = 2 GW (large coal plant); 5,000,000,000 W = 5 GW (hydro dam); 10,000,000,000 W = 10 GW (major wind region); 22,500,000,000 W = 22.5 GW (Three Gorges Dam world's largest).
Divide watts by 1,000,000,000 (one billion). Formula: GW = W ÷ 1,000,000,000. Examples: 100,000,000 W = 0.1 GW (100 MW solar farm); 500,000,000 W = 0.5 GW (500 MW wind/coal); 1,000,000,000 W = 1 GW (1 billion watts = nuclear reactor = 1,000 MW); 2,000,000,000 W = 2 GW (2 billion watts = large coal); 5,000,000,000 W = 5 GW (5 billion = hydro dam); 10,000,000,000 W = 10 GW (10 billion); 100,000,000,000 W = 100 GW (100 billion = national fleet component); 1,000,000,000,000 W = 1,000 GW = 1 TW (trillion watts = major nation capacity). Move decimal nine places left (W→GW).
1 gigawatt equals 1,000,000,000 watts (one billion watts). Formula: 1 GW = 1,000,000,000 W = \( 10^9 \) W = 1,000 MW = 1,000,000 kW. Examples: 0.1 GW = 100,000,000 W (100 MW); 0.5 GW = 500,000,000 W (500 MW); 1 GW = 1,000,000,000 W = 1 billion watts (nuclear reactor typical; serves 200,000-300,000 homes); 1.65 GW = 1,650,000,000 W (largest reactor EPR design); 2 GW = 2,000,000,000 W (large coal plant); 10 GW = 10,000,000,000 W = 10 billion watts (major hydro/wind region); 22.5 GW = 22,500,000,000 W (Three Gorges Dam China world record capacity); 100 GW = 100,000,000,000 W = 100 billion watts (national nuclear fleet USA ~95 GW); 1,000 GW = 1,000,000,000,000 W = 1 trillion watts = 1 terawatt TW (USA total ~1,200 GW). Move decimal nine places right (GW→W).
Billion-fold difference. 1 GW = 1,000,000,000 W = 1 billion watts = 1,000 MW = 1,000,000 kW. Watts for devices: light bulb 10 W; microwave 1,000 W; home 5,000-15,000 W peak. Kilowatts for commercial: building 100-500 kW; facility 1,000-5,000 kW. Megawatts for utility: solar farm 100 MW; wind farm 500 MW. Gigawatts for massive scale: nuclear plant 1-1.6 GW; hydro dam 5-22 GW; national capacity 100-2,800 GW (USA 1,200 GW; China 2,800 GW total). Both measure power (energy/time); vastly different applications. Use GW discussing national infrastructure, major facilities, grid planning, international comparisons, climate policy at country/continent/global scale.
1 gigawatt powers approximately 200,000-300,000 homes average depending on capacity factor. Calculation: Average US home 11,000 kWh/year = 1.25 kW continuous. 1 GW = 1,000,000 kW ÷ 1.25 kW = 800,000 homes instantaneous capacity. However, capacity factor critical: Solar 25% CF: 1 GW solar × 0.25 = 250,000 kW average ÷ 1.25 = 200,000 homes annually. Wind 35% CF: 1 GW × 0.35 = 280,000 kW ÷ 1.25 = 224,000 homes. Nuclear/coal 90% CF: 1 GW × 0.90 = 720,000 kW ÷ 1.25 = 576,000 homes baseload. Conservative rule: 1 GW renewable = 200,000-250,000 homes; 1 GW baseload = 600,000-800,000 homes. Three Gorges Dam 22.5 GW serves ~4.5 million homes (20% CF hydro seasonal). USA 1,200 GW capacity serves 330 million people = 140 million households (average ~8.5 GW per million people accounts for industry/commercial loads beyond residential).
100 gigawatts equals 100,000,000,000 watts (one hundred billion watts). Calculation: 100 GW × 1,000,000,000 = 100,000,000,000 W = 100 billion watts = 100,000 MW = 100,000,000 kW. This represents major national capacity component: USA nuclear fleet 95 GW = 93 reactors total; USA hydroelectric 80 GW all dams combined; Germany solar 80 GW world leader per capita; state-level capacity Texas wind ~40 GW, California solar ~30 GW combined ~70 GW renewable; national technology fleet India solar ~70 GW, China wind ~450 GW (multiple of 100 GW). Annual generation 100 GW capacity: Assuming 40% average CF mixed renewable/fossil: 100 GW × 8,760 hrs × 0.40 = 350,400 GWh = 350 TWh serves ~32 million homes @ 11,000 kWh/home. Investment: 100 GW solar × $1 billion/GW = $100 billion capital cost; 100 GW nuclear × $6 billion/GW = $600 billion (nuclear 6× more expensive per GW capacity).
1,000 gigawatts equals 1,000,000,000,000 watts (one trillion watts = 1 terawatt TW). Calculation: 1,000 GW × 1,000,000,000 = 1,000,000,000,000 W = 1 trillion watts = 1 TW = 1,000,000 MW. This represents major nation total capacity: USA 1,200 GW = 1.2 TW all generation sources (gas 550 GW + coal 200 GW + nuclear 95 GW + hydro 80 GW + wind 145 GW + solar 115 GW + other 15 GW); EU 1,100 GW combined 27 countries; China 2,800 GW = 2.8 TW world's largest (2.3× USA); global renewables: wind ~1,000 GW = 1 TW installed worldwide; solar approaching 1,500 GW = 1.5 TW globally. Annual generation: 1,000 GW × 8,760 hrs × 50% CF = 4,380 TWh = 4.38 trillion kWh serves ~400 million homes (USA generates ~4,100 TWh/year from 1,200 GW capacity = 38% average CF all sources accounts for capacity factors, utilization, seasonal patterns).
Convenience for massive scale values. Gigawatts avoid impossibly large numbers: "USA capacity 1,200 GW" clear vs "1,200,000,000,000 W" (1.2 trillion watts unreadable); "Three Gorges 22.5 GW" vs "22,500,000,000 W" (22.5 billion); "China 2,800 GW" vs "2,800,000,000,000 W" (2.8 trillion incomprehensible). Industry standards: National statistics reported GW total capacity (EIA, IEA databases); International comparisons use GW (country rankings, climate agreements NDCs); Policy targets set GW (add 500 GW renewable 2030 goals); Grid planning GW (regional interconnections, reserve margins); Financial analysis $/GW capital costs, investment billions. Scale hierarchy: Watts (W) devices; Kilowatts (kW) commercial 1,000 W; Megawatts (MW) utility plants 1,000,000 W; Gigawatts (GW) national/major facilities 1 billion W; Terawatts (TW) global capacity 1 trillion W. Choose unit matching discussion scale: GW for countries, regions, major plants; MW for individual facilities; kW for buildings. Global electricity 8,000 GW = 8 TW easier than 8,000,000 MW or 8,000,000,000,000 W.