Dependent events two events are dependent if the outcome of event A affects the outcome of event B so that the probability is changed.
Independent events two events are independent if the fact that A occurs does not affect the probability of B occurring.
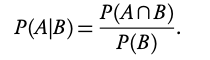
Conditional probability the probability of A, given that B has happened:
Questions involving dependent events will often involve elements that are drawn “without replacement”. Remember that the probabilities will be changing with each new set of branches.
Probabilities for successive events can be expressed through tree diagrams or a table of outcomes. Often at standard level you will deal with two successive events, but both methods can be used for more. In general, if you are dealing with a question that asks for the probability of:
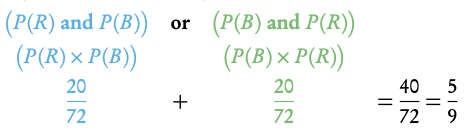
- one event and another, you multiply
- one event or another, you add
Tree diagrams
Example: Two disks are randomly drawn without replacement from a stack of 4 red and 5 blue disks. Draw a tree diagram for all outcomes.
The probability of drawing two red disks can be found by multiplying both probabilities of getting red (4/9 × 3/8).
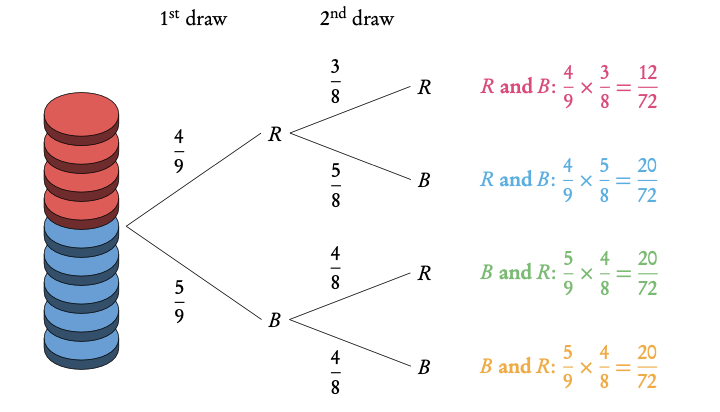
Note: The probabilities for each event should always add up to 1. The probabilities describing all the possible outcomes should also equal 1 (that is, the probabilities that we found by multiplying along the individual branches).
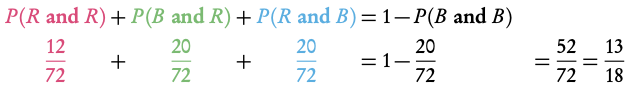
What is the probability to draw one red and one blue disk?
Note: It is common for conditional probability questions to relate to previous answers.
What is the probability to draw at least one red disk?
P (at least one red)
What is the probability of picking a blue disc given that at least one red disk is picked?

Tables of Outcomes
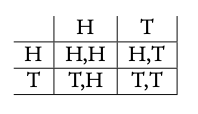
A table of outcomes has the possible outcomes for one event in the first row and the possible outcomes for another event it the first column. The table is then filled in with either the combination of these outcomes or the number of items (or probability) that fall into both events.
Example: Table of outcomes for two flips of a fair coin
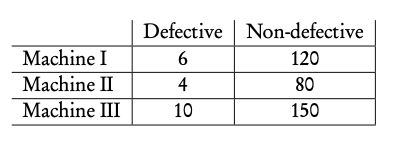
Example: Table of outcomes for three machines and the average number of defective and non-defective items they make.